<?xml version="1.0" encoding="utf-8"?><feed xmlns="http://www.w3.org/2005/Atom" ><generator uri="https://jekyllrb.com/" version="4.4.1">Jekyll</generator><link href="https://vandan.co/feed.xml" rel="self" type="application/atom+xml" /><link href="https://vandan.co/" rel="alternate" type="text/html" /><updated>2026-05-27T03:02:49+00:00</updated><id>https://vandan.co/feed.xml</id><title type="html">Optimistically Skeptical</title><subtitle>Insights from an inquisitive generalist, product management tips, travel &amp; landscape photography.</subtitle><author><name>Vandan</name><email>desai@vandan.co</email></author><entry><title type="html">My Notes live in Markdown. My Code lives in GitHub. It was only a matter of time.</title><link href="https://vandan.co/2026/05/23/my-notes-live-in-markdown-my-code-lives-in-github-it-was-only-a-matter-of-time/" rel="alternate" type="text/html" title="My Notes live in Markdown. My Code lives in GitHub. It was only a matter of time." /><published>2026-05-23T00:00:00+00:00</published><updated>2026-05-23T00:00:00+00:00</updated><id>https://vandan.co/2026/05/23/my-notes-live-in-markdown-my-code-lives-in-github-it-was-only-a-matter-of-time</id><content type="html" xml:base="https://vandan.co/2026/05/23/my-notes-live-in-markdown-my-code-lives-in-github-it-was-only-a-matter-of-time/"><![CDATA[<p>I have a confession: I’m a creature of habit when it comes to tooling.</p>

<p>For years, my notes have lived in Markdown. Not because I was forced into it but because I genuinely prefer it. There’s something freeing about writing in plain text. No proprietary formats. No mystery around what the file actually contains. Open it in any editor, on any machine, and it just works. Markdown is humble in the best possible way.</p>

<p>And for almost everything else like code, documentation, changelogs, even this app’s own roadmap; I use GitHub. Commits are how I think. Diffs are how I review. The repository is the source of truth.</p>

<p>So when I sat down to think about what Mandrill needed next, the answer arrived quickly. Almost embarrassingly quickly. My notes are Markdown. My workflow is GitHub. Of course these two things should talk to each other.</p>

<hr />

<h2 id="the-missing-link">The Missing Link</h2>

<p>Here’s a scenario I found myself in repeatedly.</p>

<p>I’d open a folder of notes in Mandrill; maybe a collection of meeting notes, a set of ideas I was developing, or documentation for a project. I’d edit a few files. Then I’d flip over to Terminal, remember which folder I was in, and run <code class="language-plaintext highlighter-rouge">git add . &amp;&amp; git commit -m "update notes" &amp;&amp; git push</code>. Every single time. I even made a shortcut.</p>

<p>The cognitive tax wasn’t huge, but it was there. A small speed bump between <em>thinking</em> and <em>shipping</em>. And speed bumps compound.</p>

<p>The folder was already a Git repository. Mandrill could see it. The <code class="language-plaintext highlighter-rouge">.git</code> folder was right there. All the information needed to understand the state of those files was sitting in plain sight. Mandrill just wasn’t looking.</p>

<hr />

<h2 id="what-changed">What Changed</h2>

<p>The latest update to Mandrill adds native GitHub integration, and it starts with something small: detection.</p>

<p>When you open a folder that’s backed by a Git repository, Mandrill now recognizes it. You’ll see it indicated right in the interface; a subtle but clear signal that this isn’t just a folder of files, it’s a folder with a history, a remote, and a purpose. The repository context is always visible.</p>

<p>From there, Mandrill tracks the state of your files. Edited a note? You’ll see it marked as modified in the sidebar. The visual feedback is immediate; the same kind of awareness you’d get in a proper code editor, now applied to your Markdown notes. You always know what’s changed and what hasn’t.</p>

<p>And when you’re ready to push those changes? You don’t need to leave Mandrill. A single action commits and pushes everything to your remote repository. No terminal switch. No copy-pasting paths. No wondering which branch you’re on. Your notes are synced with the same gesture it takes to save a document.</p>

<hr />

<h2 id="why-this-matters-to-me-at-least">Why This Matters (to Me, at Least)</h2>

<p>I build Mandrill for myself first. I am, in many ways, the target user: someone who writes a lot of Markdown, thinks in plain text, and lives inside a GitHub workflow. When I add a feature, it’s usually because I got tired of working around the absence of it.</p>

<p>This one I got tired of quickly.</p>

<p>There’s a particular kind of friction that’s hard to articulate until it’s gone. It’s not painful enough to stop you, but it’s present enough to remind you, every single time, that the tools aren’t quite working together. Switching to Terminal to push a commit felt like that. A constant small interruption.</p>

<p>Now it’s gone. I open a folder, I write, I see what changed, I push. The loop is closed inside a single app.
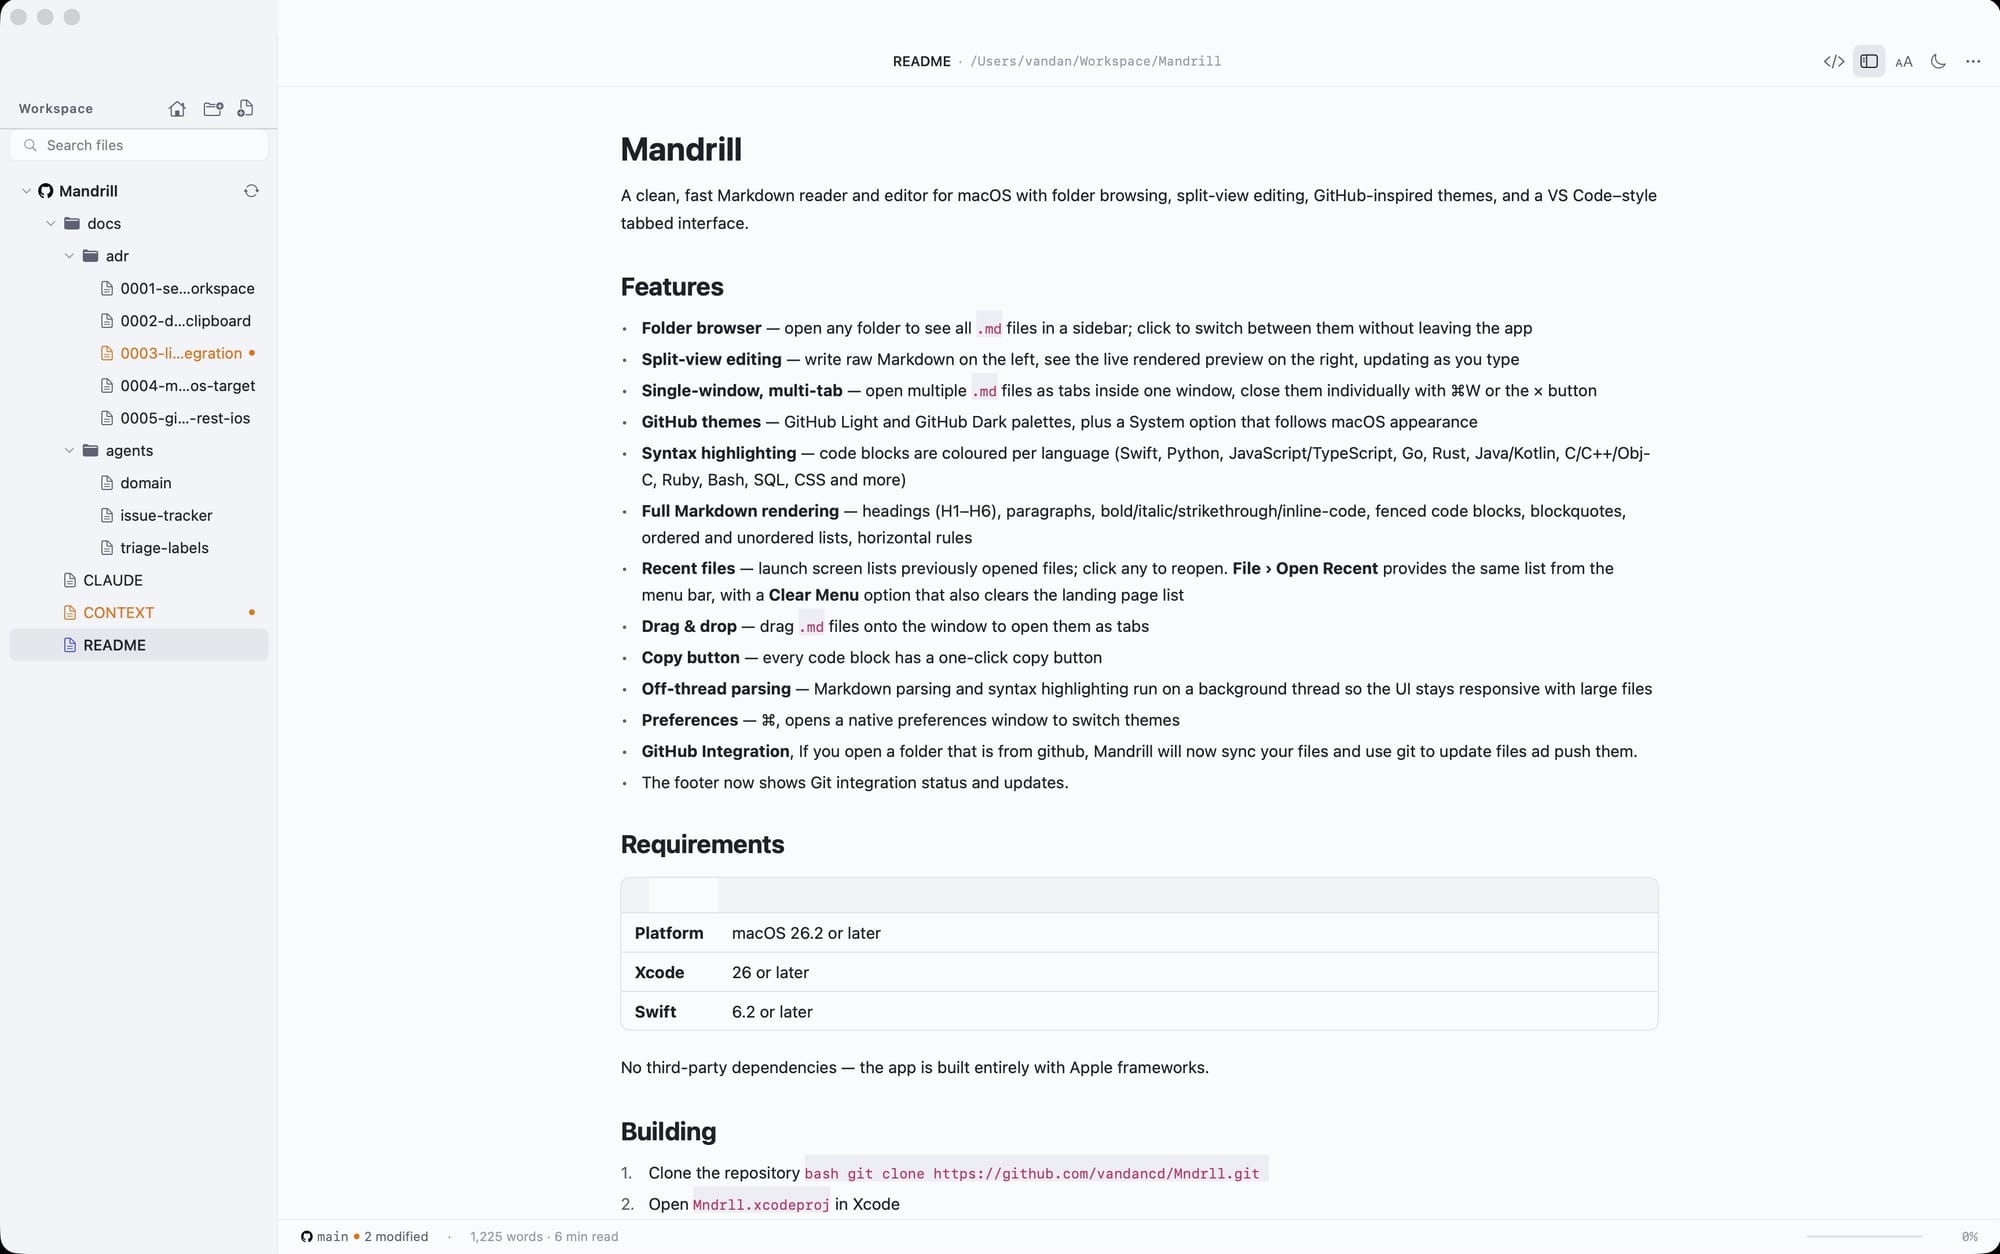
<img src="/img/2026/05/Github-Integration.jpg" alt="" /><strong>GitHub integration.</strong> Open a Git-backed folder and Mandrill identifies it instantly. Modified files are flagged in the sidebar. Push everything to GitHub in one click, without leaving the app.
—</p>

<h2 id="the-broader-idea">The Broader Idea</h2>

<p>I think a lot about what it means for an app to be <em>native</em>, not just in the technical sense (though Mandrill is genuinely a native macOS app, built with SwiftUI, no Electron in sight), but in the philosophical sense. A native experience respects the way you already work. It meets you in your workflow rather than asking you to change it.</p>

<p>For me and I suspect for a lot of developers, Vibe Coders, solopreneurs, and technical writers, the workflow runs through Git. Notes, docs, changelogs, ideas: if it matters, it lives in a repository.</p>

<p>Mandrill now understands that. And it feels, to be honest, like the app finally clicked into place.</p>

<hr />

<h2 id="try-it">Try It</h2>

<p>If you use Mandrill and keep any of your Markdown notes in a Git-backed folder, open that folder in the new version. You’ll see the integration light up immediately. The repository is detected, your modified files are tracked, and pushing is one click away.</p>

<p>If you haven’t tried Mandrill yet, <a href="https://apps.apple.com/us/app/mandrill/id6762164573?mt=12">it’s on the Mac App Store</a>. Free to try. No accounts. No telemetry. Just a fast, native Markdown editor that now speaks GitHub fluently.</p>

<p>Your notes deserve version control. They probably already have it. Mandrill just got out of the way.</p>]]></content><author><name>Vandan</name><email>desai@vandan.co</email></author><category term="Product" /><category term="App" /><category term="Markdown" /><category term="Apple" /><category term="Mandrill" /><summary type="html"><![CDATA[All my notes live in Markdown. Everything I ship lives in GitHub. So why was I still flipping to Terminal every time I finished editing a note? I got tired of it. So I fixed it.]]></summary><media:thumbnail xmlns:media="http://search.yahoo.com/mrss/" url="https://vandan.co/img/2026/05/mandrill_banner.png" /><media:content medium="image" url="https://vandan.co/img/2026/05/mandrill_banner.png" xmlns:media="http://search.yahoo.com/mrss/" /></entry><entry><title type="html">Updates to Mandrill App (already)</title><link href="https://vandan.co/2026/04/28/updates-to-mandrill-app-already/" rel="alternate" type="text/html" title="Updates to Mandrill App (already)" /><published>2026-04-28T00:00:00+00:00</published><updated>2026-04-28T00:00:00+00:00</updated><id>https://vandan.co/2026/04/28/updates-to-mandrill-app-already</id><content type="html" xml:base="https://vandan.co/2026/04/28/updates-to-mandrill-app-already/"><![CDATA[<p><a href="https://apps.apple.com/us/app/mandrill/id6762164573?mt=12"><img src="/img/2026/04/x25.jpg" alt="" /></a>
When I shipped Mandrill 1.0 last week, the goal was simple: give developers and technical writers the cleanest possible way to read Markdown on macOS.  No accounts, no cloud sync, no cruft. Open a<code class="language-plaintext highlighter-rouge">.md</code> file, see it rendered beautifully, and get on with your work.</p>

<p>The response was encouraging. But there was one piece of feedback I kept hearing: tabs worked, but they weren’t the right mental model for people who navigate between many files or want to keep their sidebar separate from their reading area. So I rebuilt it.</p>

<h2 id="new-left-navigation-panel">New: Left navigation panel</h2>

<p>The tab bar is gone. In its place is a persistent left-hand navigation panel; a much more natural way to manage multiple open Markdown files. You can see all your documents at a glance, jump between them instantly, and keep your reading area completely clean.</p>

<p>The change might sound small, but it fundamentally shifts how the app feels to use. Instead of a browser-style top bar, you now have something closer to a proper document workspace the kind of focused, structured layout that tools like VS Code and Obsidian have proven works well for file-heavy workflows.</p>

<h2 id="keyboard-shortcuts-finally">Keyboard shortcuts, finally</h2>

<p>If you live at the keyboard, Mandrill 2.0 should feel like home. I’ve added a full set of shortcuts so you can navigate files, toggle the sidebar, and change your reading preferences without ever reaching for the mouse.</p>

<p>Open a file⌘ O</p>

<p>Toggle sidebar⇧ ⌘ D</p>

<p>Toggle Bettween Tabs^ tab</p>

<p>Increase font size⌘ +</p>

<p>Decrease font size⌘ −</p>

<p>Actual Size⌘ 0</p>

<h2 id="easier-font--theme-controls">Easier font &amp; theme controls</h2>

<p>Reading comfort matters. In 2.0 I’ve made it quicker to dial in exactly how you want your Markdown to look. Font size, typeface, and theme; GitHub Light, GitHub Dark, or System (which follows your macOS appearance automatically). These are all a shortcut or one-click away.</p>

<p>This was always the pitch for Mandrill, and 2.0 makes it feel even more true. Less time fiddling with settings, more time actually reading.</p>

<h2 id="privacy-by-design">Privacy, by design</h2>

<blockquote>
  <p><strong>Zero data collected.</strong> Mandrill has no analytics, no crash reporting that phones home, no accounts. The App Store listing reflects this: the developer collects no data from the app, period. What you read stays on your Mac.</p>
</blockquote>

<h2 id="whats-next">What’s next</h2>

<p>I’m already thinking about what comes after 2.0. A few things on the list: better support for internal Markdown links, and possibly a way to open folders so you can browse a whole documentation tree in the sidebar.</p>

<p>If you have a feature request or you’ve run into a bug, reach out; I read everything. And if Mandrill is useful to you, an App Store review genuinely helps other developers find it.
<a href="https://apps.apple.com/us/app/mandrill/id6762164573?mt=12"><img src="/img/2026/04/x25-1.jpg" alt="" /></a></p>]]></content><author><name>Vandan</name><email>desai@vandan.co</email></author><category term="App" /><category term="Product" /><category term="Product Management" /><category term="Mandrill" /><summary type="html"><![CDATA[Version 2.0 replaces the tabbed interface with a brand-new left navigation, adds a full keyboard shortcut system, and makes font & theme customization faster than ever.]]></summary></entry><entry><title type="html">Introducing Mandrill</title><link href="https://vandan.co/2026/04/26/introducing-mandrill/" rel="alternate" type="text/html" title="Introducing Mandrill" /><published>2026-04-26T00:00:00+00:00</published><updated>2026-04-26T00:00:00+00:00</updated><id>https://vandan.co/2026/04/26/introducing-mandrill</id><content type="html" xml:base="https://vandan.co/2026/04/26/introducing-mandrill/"><![CDATA[<p><em>A Markdown reader that gets out of the way.</em></p>

<p>Every developer has been there. You clone a repo, open the <code class="language-plaintext highlighter-rouge">README.md</code>, and stare at a wall of raw Markdown syntax instead of the formatted document the author intended. So you open VS Code, install a preview extension, and wait. Or you push it to GitHub just to read it. Or you squint and mentally parse the asterisks yourself.</p>

<p>None of those are good answers. That frustration is exactly why I built Mandrill.</p>

<blockquote>
  <p><em>Mandrill does one thing: it opens a *<code class="language-plaintext highlighter-rouge">.md</code></em> file and renders it beautifully. That’s it.*</p>
</blockquote>

<p><a href="https://apps.apple.com/us/app/mandrill/id6762164573?mt=12 Mandrill"><img src="/img/2026/04/Mndrllx1@0.1x.png" alt="" /></a></p>
<h3 id="built-for-the-way-developers-actually-work">Built for the way developers actually work</h3>

<p>Mandrill is a native macOS application. Drag a file onto it, or open one from the file picker, and your Markdown is rendered instantly; headings, code blocks, tables, task lists, and all. No setup wizard. No account. No cloud sync. The file never leaves your machine.</p>

<h3 id="whats-inside">What’s Inside</h3>

<ul>
  <li>Renders GitHub-flavored Markdown including headings, tables, task lists, and blockquotes</li>
  <li>Syntax highlighting in fenced code blocks</li>
  <li>Drag-and-drop or standard file picker — open any<code class="language-plaintext highlighter-rouge">.md</code>file in one step</li>
  <li>Fully offline — no network requests, ever</li>
  <li>No account, no sign-up, no data collected of any kind</li>
  <li>Lightweight and fast — launches in under a second</li>
</ul>

<h3 id="privacy-by-design">Privacy by design</h3>

<p>Mandrill has no analytics, no crash reporting, and no telemetry of any kind. We have no idea how many people use it, what files they open, or where they are in the world  and I prefer it that way. Your files are yours. The app is a tool, not a data collection endpoint.</p>

<p>This also means Mandrill works in air-gapped environments, on planes, and anywhere else you need to read a document without a network connection.</p>

<h3 id="a-small-app-with-a-clear-purpose">A small app with a clear purpose</h3>

<p>I deliberately kept Mandrill small. It isn’t a Markdown editor (yet), a note-taking app, or a writing environment. Those tools exist and many of them are excellent. Mandrill fills a specific gap: reading Markdown files quickly, cleanly, and without friction. If you find yourself reaching for a heavy editor just to preview a document, Mandrill is the tool that was missing from your Mac.
<a href="https://apps.apple.com/us/app/mandrill/id6762164573?mt=12 Mandrill"><img src="/img/2026/04/Download_on_the_Mac_App_Store_Badge_US-UK_RGB_blk_092917@25@0.25x-1.jpg" alt="" /></a></p>]]></content><author><name>Vandan</name><email>desai@vandan.co</email></author><category term="Product" /><category term="App" /><category term="Markdown" /><category term="Apple" /><category term="Mandrill" /><summary type="html"><![CDATA[You shouldn't need a code editor just to read a README. Mandrill renders Markdown files beautifully on macOS offline, instantly, and without asking for an account.]]></summary><media:thumbnail xmlns:media="http://search.yahoo.com/mrss/" url="https://vandan.co/img/2026/05/mandrill_banner.png" /><media:content medium="image" url="https://vandan.co/img/2026/05/mandrill_banner.png" xmlns:media="http://search.yahoo.com/mrss/" /></entry><entry><title type="html">A Quiet Moment at Sensoji</title><link href="https://vandan.co/2026/04/07/a-quiet-moment-at-sensoji/" rel="alternate" type="text/html" title="A Quiet Moment at Sensoji" /><published>2026-04-07T00:00:00+00:00</published><updated>2026-04-07T00:00:00+00:00</updated><id>https://vandan.co/2026/04/07/a-quiet-moment-at-sensoji</id><content type="html" xml:base="https://vandan.co/2026/04/07/a-quiet-moment-at-sensoji/"><![CDATA[<p>There’s something striking about looking up in Japan.</p>

<p>At <a href="chatgpt://generic-entity?number=0">Sensoji</a>, one of the oldest and most storied temples in Tokyo, it’s easy to get swept up in the crowds, the incense smoke, and the energy of <a href="chatgpt://generic-entity?number=1">Asakusa</a>. But sometimes, the most memorable moments come when you pause and look above it all.
<img src="/img/2026/04/5O0A2532.jpg" alt="" />
The bold vermilion beams cut sharply against a soft, washed out, empty sky. The layered rooflines, almost floating, reveal the precision and symmetry that define traditional Japanese architecture. Every joint, every curve, every ornamental detail feels intentional; crafted not just for structure, but for beauty.</p>
<p>What stood out to me wasn’t just the scale of the temple, but the quiet discipline in its design. Even in a place filled with thousands of visitors, there are these pockets of stillness. If you isolate a single frame the noise disappears, leaving only form, color, and history.</p>

<p>Senso-ji dates back to the 7th century, yet it doesn’t feel old in the way ruins do. It feels preserved. Alive. Maintained with care and respect, as if each generation understands they are only temporary custodians of something much larger than themselves.</p>

<p>And maybe that’s what this image represents. Not just a temple but continuity.</p>

<p>A reminder that even in a fast-moving city like Tokyo, there are places where time slows down. Where craftsmanship outlives trends. Where looking up is enough to ground you.</p>]]></content><author><name>Vandan</name><email>desai@vandan.co</email></author><category term="Photography" /><summary type="html"><![CDATA[Sometimes, the most powerful way to experience a place is to look up. At Sensoji, above the crowds and noise, timeless design and quiet beauty come into focus.]]></summary><media:thumbnail xmlns:media="http://search.yahoo.com/mrss/" url="https://vandan.co/img/2026/04/5O0A2524-2.jpg" /><media:content medium="image" url="https://vandan.co/img/2026/04/5O0A2524-2.jpg" xmlns:media="http://search.yahoo.com/mrss/" /></entry><entry><title type="html">Understanding Inter-Arrival Time - The Hidden Performance Metric</title><link href="https://vandan.co/2026/02/01/understanding-inter-arrival-time-the-hidden-performance-metric/" rel="alternate" type="text/html" title="Understanding Inter-Arrival Time - The Hidden Performance Metric" /><published>2026-02-01T00:00:00+00:00</published><updated>2026-02-01T00:00:00+00:00</updated><id>https://vandan.co/2026/02/01/understanding-inter-arrival-time-the-hidden-performance-metric</id><content type="html" xml:base="https://vandan.co/2026/02/01/understanding-inter-arrival-time-the-hidden-performance-metric/"><![CDATA[<p>In the realm of AI chatbots, when evaluating the performance of an application, the most <a href="https://vandan.co/peek-into-your-favorite-ai-chatbots-user-experience/">fundamental metrics that I prioritize</a> include the time elapsed to receive the initial chunk of data after a message is sent, the number of chunks received, and the total time taken to receive all the messages. However, similar to latency, the absence of data regarding the time intervals between each chunk is a significant oversight.</p>

<p>Consider the analogy of watching a movie of equal duration, where the total time is constant. When the movie maintains a consistent frame rate of 24fps, it appears smooth and immersive. Conversely, if the movie randomly fluctuates between 5-60fps, it becomes janky and even irritating.</p>

<p>Consistency matters!</p>

<p>**Inter-Arrival Time **is simply the time gap between receiving consecutive  chunks of data.</p>

<p><strong>For Example:</strong></p>

<div class="language-plaintext highlighter-rouge"><div class="highlight"><pre class="highlight"><code>Chunk 1 arrives at: 0ms
Chunk 2 arrives at: 45ms    → Inter-arrival: 45ms
Chunk 3 arrives at: 90ms    → Inter-arrival: 45ms
Chunk 4 arrives at: 180ms   → Inter-arrival: 90ms
Chunk 5 arrives at: 220ms   → Inter-arrival: 40ms
</code></pre></div></div>

<p><strong>Average inter-arrival time:</strong> (45 + 45 + 90 + 40) / 4 = 55ms</p>

<h2 id="why-inter-arrival-time-is-critical"><strong>Why Inter-Arrival Time is Critical</strong></h2>

<p><strong>Perceived Performance</strong></p>

<ol>
  <li>
    <p><strong>Inconsistent (Bad):</strong></p>

    <p>Gaps: 10ms, 500ms, 20ms, 400ms, 15ms, 600ms
 Average: 257ms
 Feeling: Stuttery, unpredictable, frustrating</p>
  </li>
  <li>
    <p><strong>Consistent (Good):</strong></p>

    <p>Gaps: 250ms, 260ms, 255ms, 250ms, 265ms, 240ms
 Average: 253ms
 Feeling: Smooth, predictable, pleasant</p>
  </li>
</ol>

<p>As you can see in both cases, the average is more or less the same but the user experience is completely different.</p>

<p><strong>Network Quality Indicator</strong></p>

<ol>
  <li>
    <p><strong>Stable connection:</strong></p>

    <p>Inter-arrival times: 40ms, 42ms, 38ms, 41ms, 40ms
 Standard deviation: ~1.5ms
 Meaning: Great connection!</p>
  </li>
  <li>
    <p><strong>Poor connection:</strong></p>

    <p>Inter-arrival times: 20ms, 200ms, 30ms, 500ms, 25ms
 Standard deviation: ~200ms
 Meaning: Packet loss, congestion, or throttling</p>
  </li>
</ol>

<p><strong>Server Health</strong></p>

<ol>
  <li>
    <p><strong>Healthy server:</strong></p>

    <p>Consistent gaps: 30-50ms throughout
 Meaning: Server processing steadily</p>
  </li>
  <li>
    <p><strong>Struggling server:</strong></p>

    <p>Increasing gaps: 30ms → 50ms → 100ms → 200ms
 Meaning: Server under load, getting slower</p>
  </li>
</ol>

<h2 id="measuring-inter-arrival-time-in-console"><strong>Measuring Inter-Arrival Time in Console</strong></h2>

<p>Paste the below scrip in your Chrome Developer tools console:</p>

<div class="language-plaintext highlighter-rouge"><div class="highlight"><pre class="highlight"><code>(function() {
    const originalFetch = window.fetch;
    window.fetch = async function(...args) {
        const response = await originalFetch(...args);
        const contentType = response.headers.get('Content-Type');
        
        if (contentType?.includes('text/event-stream')) {
            console.log('📊 Monitoring inter-arrival times...');
            
            const reader = response.clone().body.getReader();
            const times = [];
            let lastTime = performance.now();
            let chunkCount = 0;
            
            while (true) {
                const {done, value} = await reader.read();
                if (done) break;
                
                const now = performance.now();
                const gap = now - lastTime;
                
                if (chunkCount &gt; 0) { // Skip first chunk (no previous time)
                    times.push(gap);
                }
                
                chunkCount++;
                lastTime = now;
            }
            
            // Calculate statistics
            const avg = times.reduce((a,b) =&gt; a+b, 0) / times.length;
            const min = Math.min(...times);
            const max = Math.max(...times);
            const sorted = [...times].sort((a,b) =&gt; a-b);
            const median = sorted[Math.floor(sorted.length/2)];
            
            // Calculate standard deviation
            const variance = times.reduce((sum, val) =&gt; 
                sum + Math.pow(val - avg, 2), 0) / times.length;
            const stdDev = Math.sqrt(variance);
            
            console.log('📈 Inter-Arrival Analysis:');
            console.log('  Total chunks:', chunkCount);
            console.log('  Average gap:', avg.toFixed(2) + 'ms');
            console.log('  Median gap:', median.toFixed(2) + 'ms');
            console.log('  Min gap:', min.toFixed(2) + 'ms');
            console.log('  Max gap:', max.toFixed(2) + 'ms');
            console.log('  Std deviation:', stdDev.toFixed(2) + 'ms');
            console.log('  Consistency:', stdDev &lt; 50 ? '✅ Excellent' : 
                        stdDev &lt; 100 ? '⚠️ Good' : '❌ Poor');
            
            // Show distribution
            console.log('\n📊 Distribution:');
            const buckets = [0, 25, 50, 100, 200, 500, Infinity];
            const labels = ['0-25ms', '25-50ms', '50-100ms', '100-200ms', '200-500ms', '&gt;500ms'];
            
            labels.forEach((label, i) =&gt; {
                const count = times.filter(t =&gt; 
                    t &gt;= buckets[i] &amp;&amp; t &lt; buckets[i+1]
                ).length;
                const bar = '█'.repeat(Math.round(count / times.length * 20));
                console.log(`  ${label.padEnd(12)} ${bar} ${count}`);
            });
            
            // Store for later analysis
            window.lastInterArrivalTimes = times;
        }
        
        return response;
    };
})();
</code></pre></div></div>

<p>Below is an example out on a good experience I had today:</p>

<div class="language-plaintext highlighter-rouge"><div class="highlight"><pre class="highlight"><code>📊 Monitoring inter-arrival times...
📈 Inter-Arrival Analysis:
  Total chunks: 245
  Average gap: 42.15ms
  Median gap: 38.50ms
  Min gap: 12.30ms
  Max gap: 156.80ms
  Std deviation: 23.45ms
  Consistency: ✅ Excellent

📊 Distribution:
  0-25ms       ███░░░░░░░░░░░░░░░░░ 38
  25-50ms      ████████████████░░░░ 156
  50-100ms     ███░░░░░░░░░░░░░░░░░ 42
  100-200ms    ░░░░░░░░░░░░░░░░░░░░ 8
  200-500ms    ░░░░░░░░░░░░░░░░░░░░ 1
  &gt;500ms       ░░░░░░░░░░░░░░░░░░░░ 0
</code></pre></div></div>

<p>And for the same question I used a different chatbot and the experience was quiet different:</p>

<div class="language-plaintext highlighter-rouge"><div class="highlight"><pre class="highlight"><code>📊 Monitoring inter-arrival times...
📈 Inter-Arrival Analysis:
  Total chunks: 53
  Average gap: 159.14ms
  Median gap: 68.80ms
  Min gap: 0.40ms
  Max gap: 1744.90ms
  Std deviation: 263.13ms
  Consistency: ❌ Poor
 
📊 Distribution:
  0-25ms       ███████░░░░░░░░░░░░░ 17
  25-50ms      █░░░░░░░░░░░░░░░░░░░ 2
  50-100ms     ███░░░░░░░░░░░░░░░░░ 9
  100-200ms    ███░░░░░░░░░░░░░░░░░ 7
  200-500ms    ██████░░░░░░░░░░░░░░ 15
  &gt;500ms       ███░░░░░░░░░░░░░░░░░ 2
</code></pre></div></div>

<p>Inter-arrival time, also known as jitter, is a significant factor that contributes to the perception of faster performance in certain artificial intelligence (AI) systems. It serves as a diagnostic tool for identifying connection issues and helps determine which AI model is optimized for providing a seamless user experience.</p>

<p>For developers, this information provides insights into server performance characteristics, identifies potential optimization opportunities, and enables the measurement of user experience quality.</p>]]></content><author><name>Vandan</name><email>desai@vandan.co</email></author><category term="AI" /><category term="Product Management" /><category term="Observability" /><summary type="html"><![CDATA[Inter-Arrival Time is simply the time gap between receiving consecutive  chunks of data.]]></summary><media:thumbnail xmlns:media="http://search.yahoo.com/mrss/" url="https://vandan.co/img/2026/02/jitter.png" /><media:content medium="image" url="https://vandan.co/img/2026/02/jitter.png" xmlns:media="http://search.yahoo.com/mrss/" /></entry><entry><title type="html">Peek into your favorite AI Chatbot’s User Experience</title><link href="https://vandan.co/2026/01/15/peek-into-your-favorite-ai-chatbots-user-experience/" rel="alternate" type="text/html" title="Peek into your favorite AI Chatbot’s User Experience" /><published>2026-01-15T00:00:00+00:00</published><updated>2026-01-15T00:00:00+00:00</updated><id>https://vandan.co/2026/01/15/peek-into-your-favorite-ai-chatbots-user-experience</id><content type="html" xml:base="https://vandan.co/2026/01/15/peek-into-your-favorite-ai-chatbots-user-experience/"><![CDATA[<p>Ever wondered how fast your AI chatbot really is? How it streams responses? For an enterprise, it’s about ensuring they effectively serve their intended purpose, deliver tangible business value, maintain user trust, and contribute positively to the overall digital experience for both customers and employees.</p>

<p>Without robust monitoring, an enterprise is operating its AI chatbot initiative blindly, risking inefficiencies, user dissatisfaction and wasted investment.</p>

<p>To track any kind of performance/user experience monitoring one needs to understand how these chatbots work.  Modern AI chatbots don’t send you the entire response at once. They <strong>stream</strong> it; i.e. sending small chunks as they generate them. This creates that satisfying “typing” effect.</p>

<p>I started using ChatGPT and eventually transitioned to Claude  or Google Gemini depending on my use case.  And there is no surprise that different chatbots use different mechanisms to stream data.</p>

<ol>
  <li><strong>Server-Sent Events (SSE)</strong> - Used by Claude, ChatGPT, Perplexity</li>
  <li><strong>XHR Streaming</strong> - Used by Google Gemini</li>
  <li><strong>WebSocket</strong> - Used by Microsoft Copilot</li>
</ol>

<p>Let’s take a look behind the scenes on how these work.  On any of your chromium browser, open up your Developer Tools and navigate to the “Network” tab.</p>

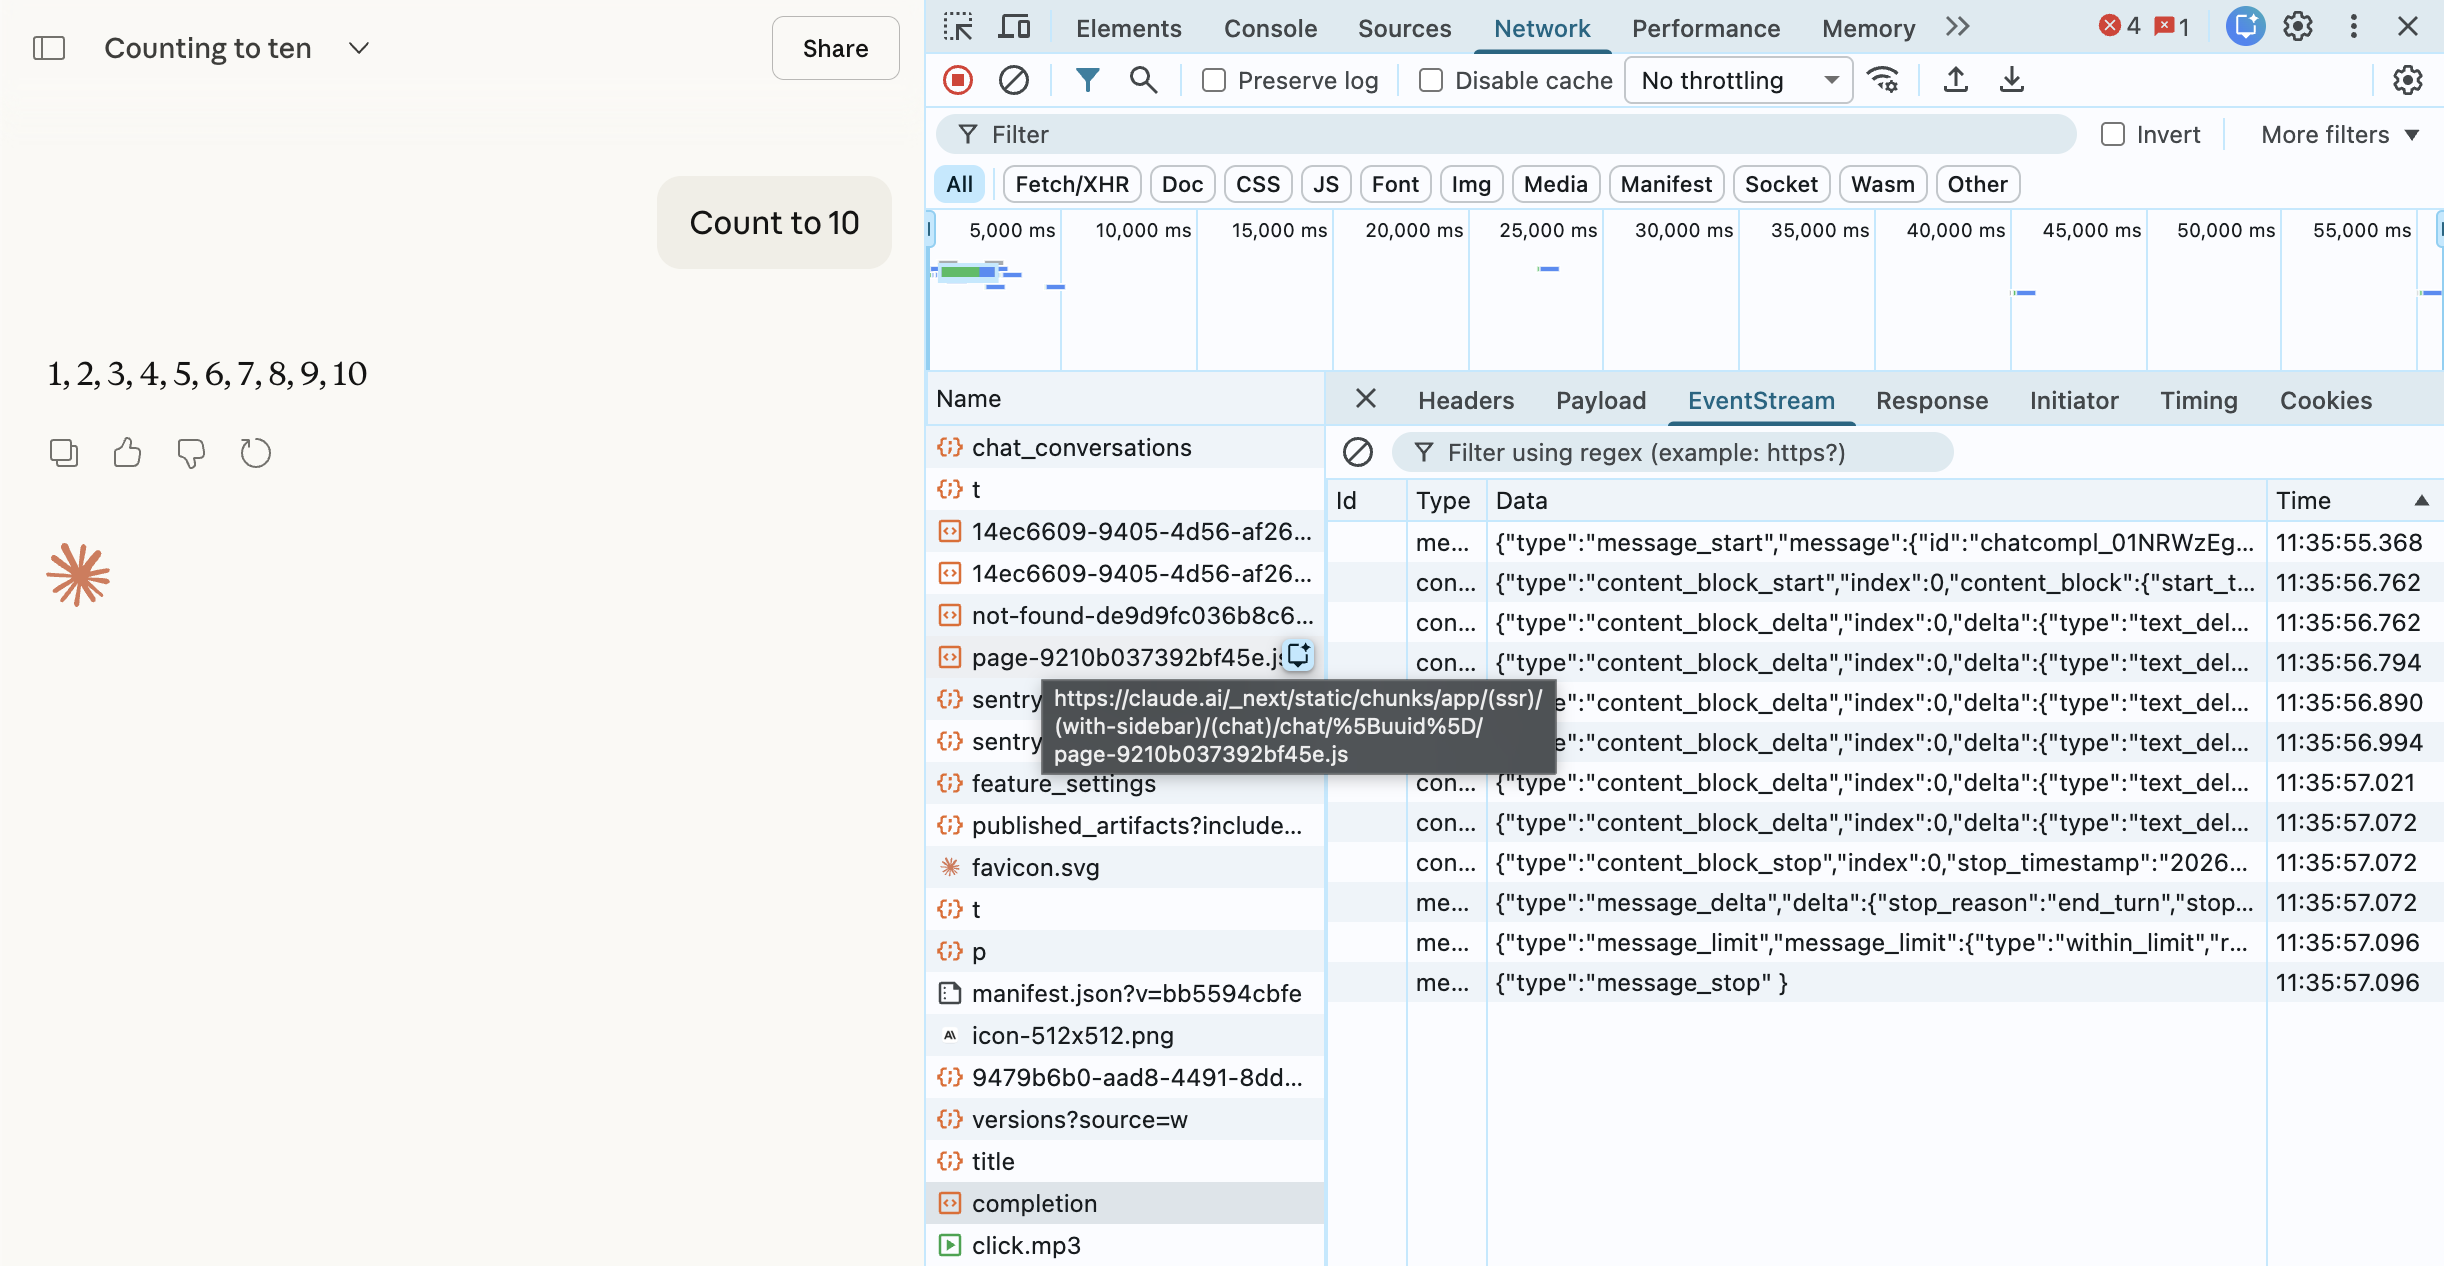
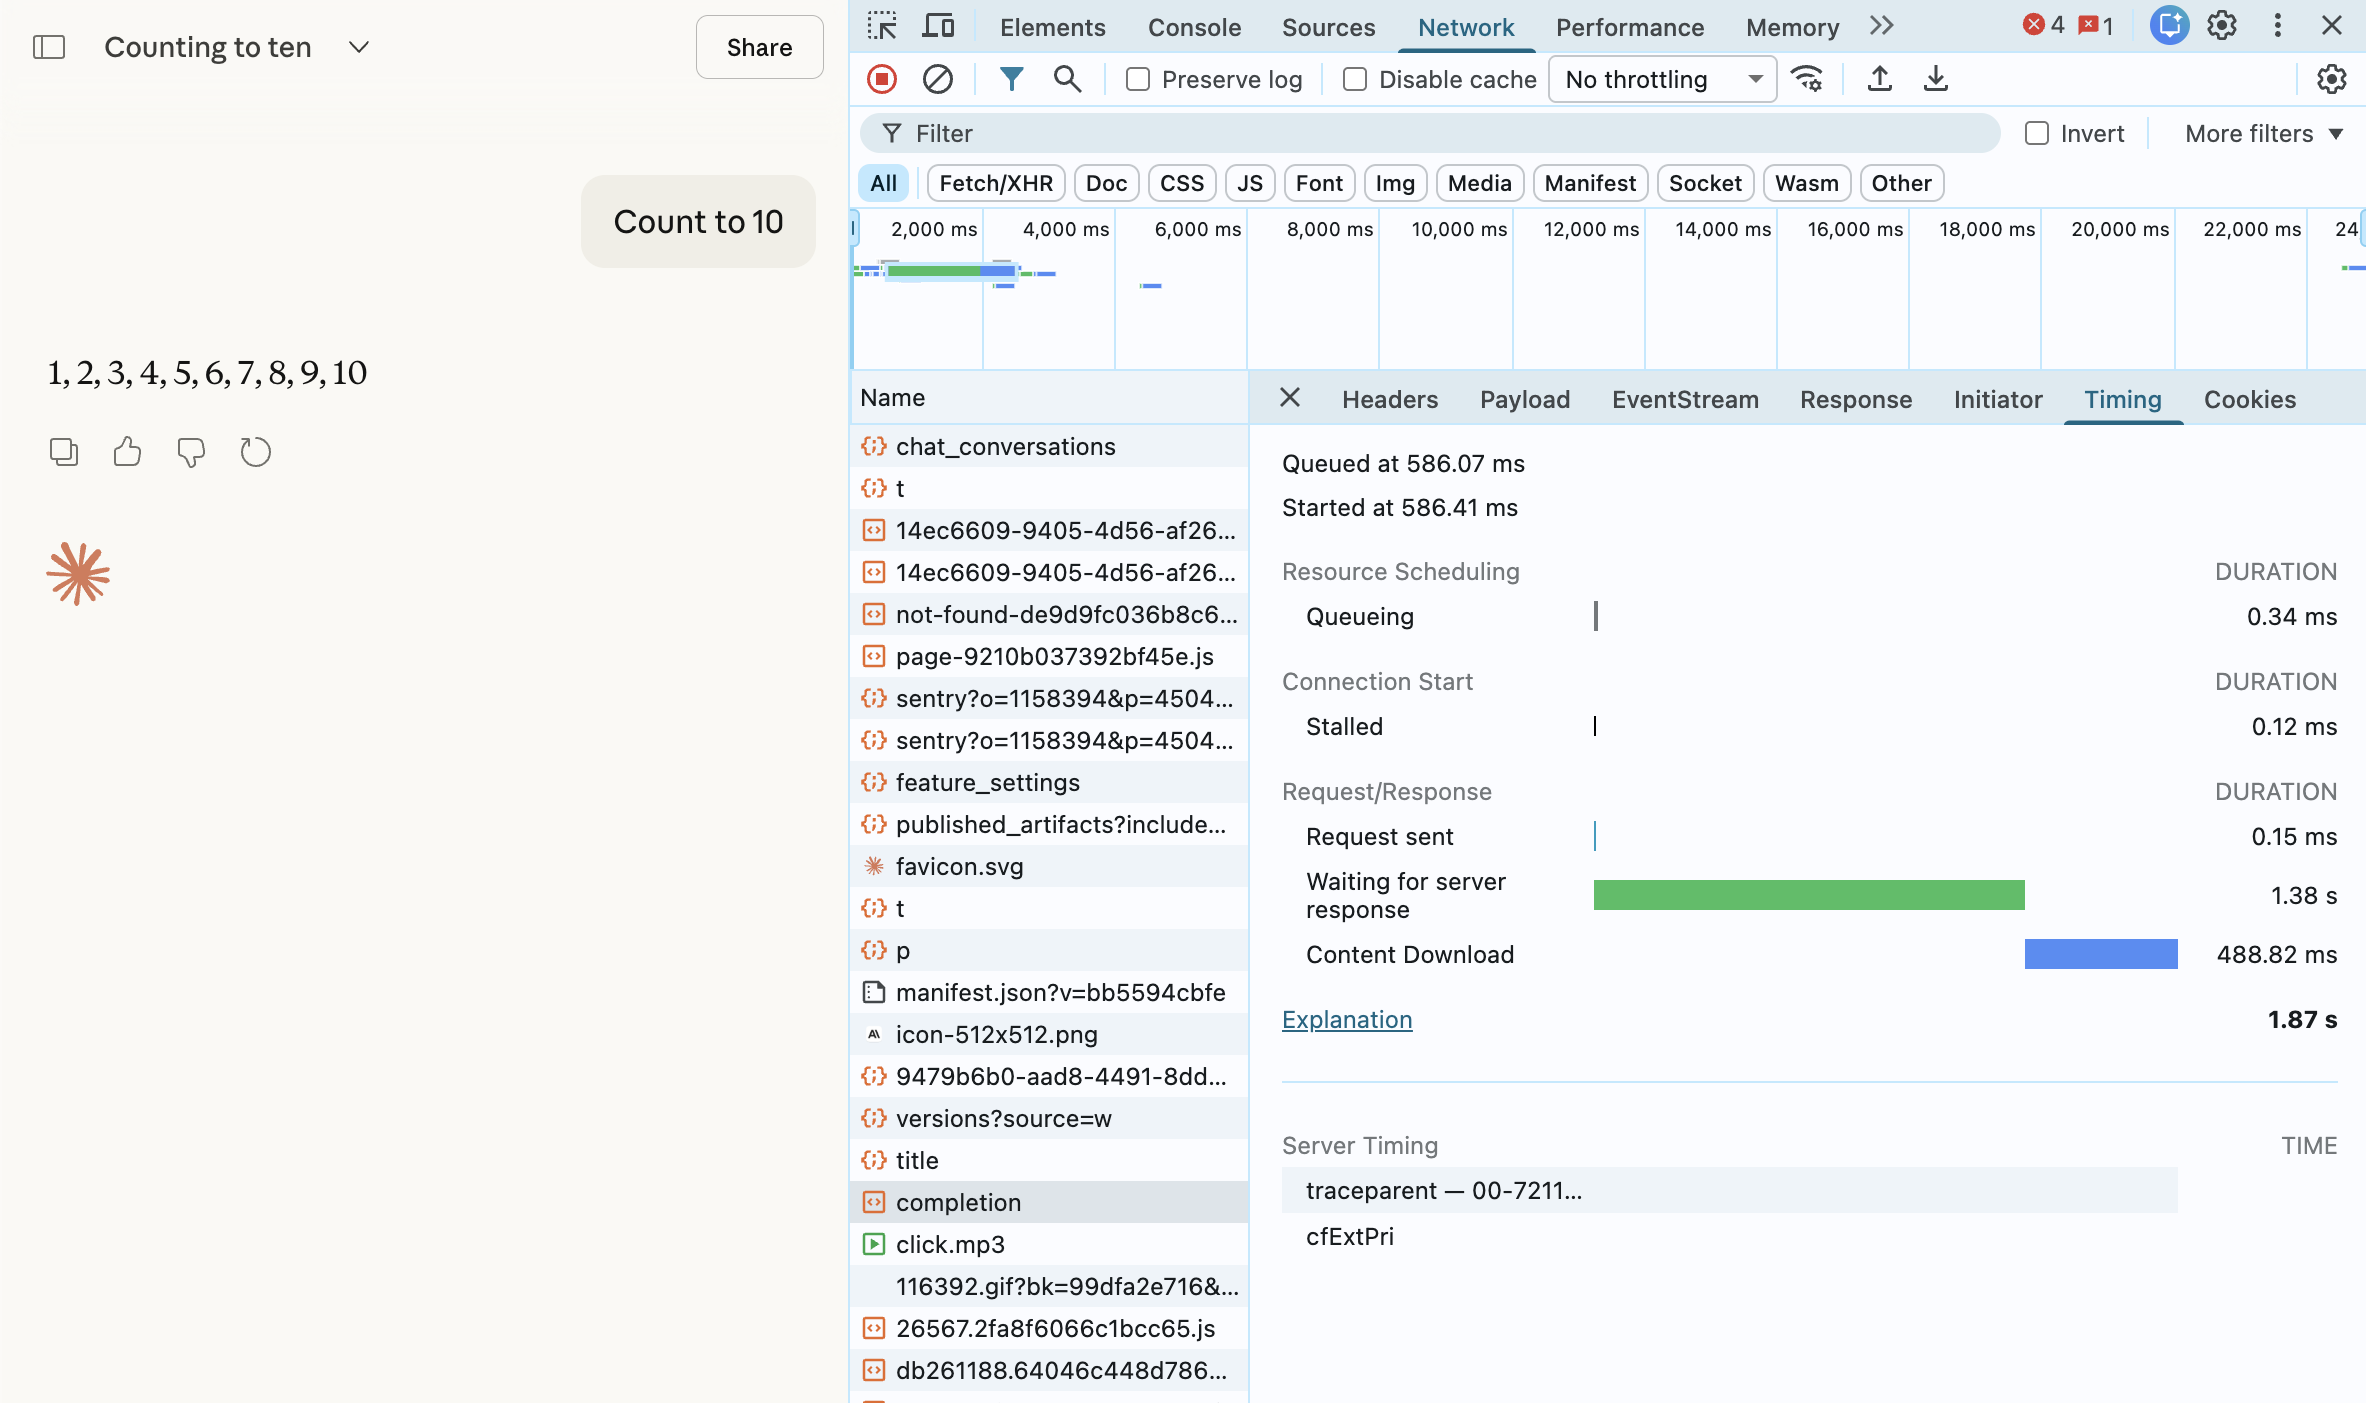
<p>I’m using <a href="https://www.claude.ai">Claude.ai</a> for this example.  Now, click the clear icon to start fresh.  Once cleared, go to your UI and send a message “Count to 10”</p>

<p>In your DevTools, Network Tab:</p>

<div class="language-plaintext highlighter-rouge"><div class="highlight"><pre class="highlight"><code>1. Look for a request containing "completion"
2. Click on it
3. Go to "Timing" tab
</code></pre></div></div>

<p><img src="/img/2026/01/Timing.png" alt="" />
<strong>What to look for:</strong></p>

<ul>
  <li><strong>Name:</strong> …/completion</li>
  <li><strong>Status:</strong> 200</li>
  <li><strong>Type:</strong> fetch or eventsource</li>
  <li><strong>Time:</strong> How long the stream lasted</li>
  <li><strong>Size:</strong> Total data transferred</li>
</ul>

<p><strong>Reading the Timing Tab:</strong></p>

<div class="language-plaintext highlighter-rouge"><div class="highlight"><pre class="highlight"><code>Waiting (TTFB): Time until first byte 
Content Download: How long streaming took
</code></pre></div></div>

<p>Click on the EventStream (or Response) 
<img src="/img/2026/01/Event-Stream.png" alt="" />
Each <code class="language-plaintext highlighter-rouge">event: message</code> block is one chunk!</p>

<p>Pretty cool.  You can now take one more step further and write a simple script to basically look at a few important metrics.  To get started, the most basic metrics I like to see the time it took to get the first chunk after I sent a message, how many chunks were received and the total time.</p>

<p>In your Chrome Developer Tools, navigate to the “Console” tab and paste this script (thanks <a href="http://Claude.ai">Claude.ai</a>):</p>

<div class="language-plaintext highlighter-rouge"><div class="highlight"><pre class="highlight"><code>// Monitor for Claude (SSE)
(function() {
    const originalFetch = window.fetch;
    window.fetch = async function(...args) {
        const start = Date.now();
        const response = await originalFetch(...args);
        
        const url = args[0];
        const contentType = response.headers.get('Content-Type');
        
        if (contentType &amp;&amp; contentType.includes('text/event-stream')) {
            console.log('🔥 Streaming response detected!');
            console.log('URL:', url);
            
            const reader = response.clone().body.getReader();
            const decoder = new TextDecoder();
            let chunks = 0;
            let firstChunk = null;
            
            while (true) {
                const {done, value} = await reader.read();
                if (done) break;
                
                chunks++;
                if (!firstChunk) {
                    firstChunk = Date.now() - start;
                    console.log('⏱️ Time to first chunk:', firstChunk + 'ms');
                }
            }
            
            const total = Date.now() - start;
            console.log('📊 Total chunks:', chunks);
            console.log('⏰ Total time:', total + 'ms');
        }
        
        return response;
    };
    
    console.log('✅ Monitor active! Send a message to Claude.');
})();
</code></pre></div></div>

<p>Once you paste this in your console tab, you should see this message:</p>

<div class="language-plaintext highlighter-rouge"><div class="highlight"><pre class="highlight"><code>✅ Monitor active! Send a message to Claude.
</code></pre></div></div>

<p>This time I asked Claude to count o 100.  As you hit enter, the console tab should show our the below results:</p>

<div class="language-plaintext highlighter-rouge"><div class="highlight"><pre class="highlight"><code>🔥 Streaming response detected!
URL: /api/organizations/.../completion
⏱️ Time to first chunk: 2269ms
📊 Total chunks: 39
⏰ Total time: 4550ms
</code></pre></div></div>

<p>Pretty neat!  Similarly you can capture these metrics for different AI Chatbot’s and view the user experience.</p>

<p>This is particularly useful to ensure positive user experience &amp; satisfaction, driving operational efficiency and cost savings, optimizing performance, improving business outcomes and understanding scalability &amp; capacity.</p>

<p>To make your user experience dashboard even more powerful, consider adding a few more advanced metrics. Here are a few ideas:</p>

<p><strong>Calculate tokens per second (Measure Typing Speed)</strong></p>

<div class="language-plaintext highlighter-rouge"><div class="highlight"><pre class="highlight"><code>// Calculate tokens per second
const startTime = Date.now();
let tokenCount = 0;

// Watch the DOM for changes
const observer = new MutationObserver(() =&gt; {
    const responseText = document.querySelector('.response-text')?.innerText || '';
    tokenCount = responseText.split(' ').length;
});

observer.observe(document.body, { 
    subtree: true, 
    childList: true 
});

// After response completes, run:
const duration = (Date.now() - startTime) / 1000;
console.log('Tokens per second:', (tokenCount / duration).toFixed(2));
</code></pre></div></div>

<p><strong>Check Connection Quality</strong></p>

<div class="language-plaintext highlighter-rouge"><div class="highlight"><pre class="highlight"><code>// See all active connections
console.table(
    performance.getEntriesByType('resource')
        .filter(e =&gt; e.initiatorType === 'fetch' || e.initiatorType === 'xmlhttprequest')
        .map(e =&gt; ({
            name: e.name.split('/').pop(),
            duration: Math.round(e.duration) + 'ms',
            size: Math.round(e.transferSize / 1024) + 'KB'
        }))
);
</code></pre></div></div>

<p>**Monitor Network Speed **</p>

<div class="language-plaintext highlighter-rouge"><div class="highlight"><pre class="highlight"><code>// Check if you have slow connection
if (navigator.connection) {
    const conn = navigator.connection;
    console.log('Connection type:', conn.effectiveType);
    console.log('Downlink speed:', conn.downlink + ' Mbps');
    console.log('RTT:', conn.rtt + 'ms');
}
</code></pre></div></div>

<p><em><strong>Tip:</strong> Bookmark this guide and test your AI platforms monthly - performance changes over time as models and infrastructure improve!</em></p>

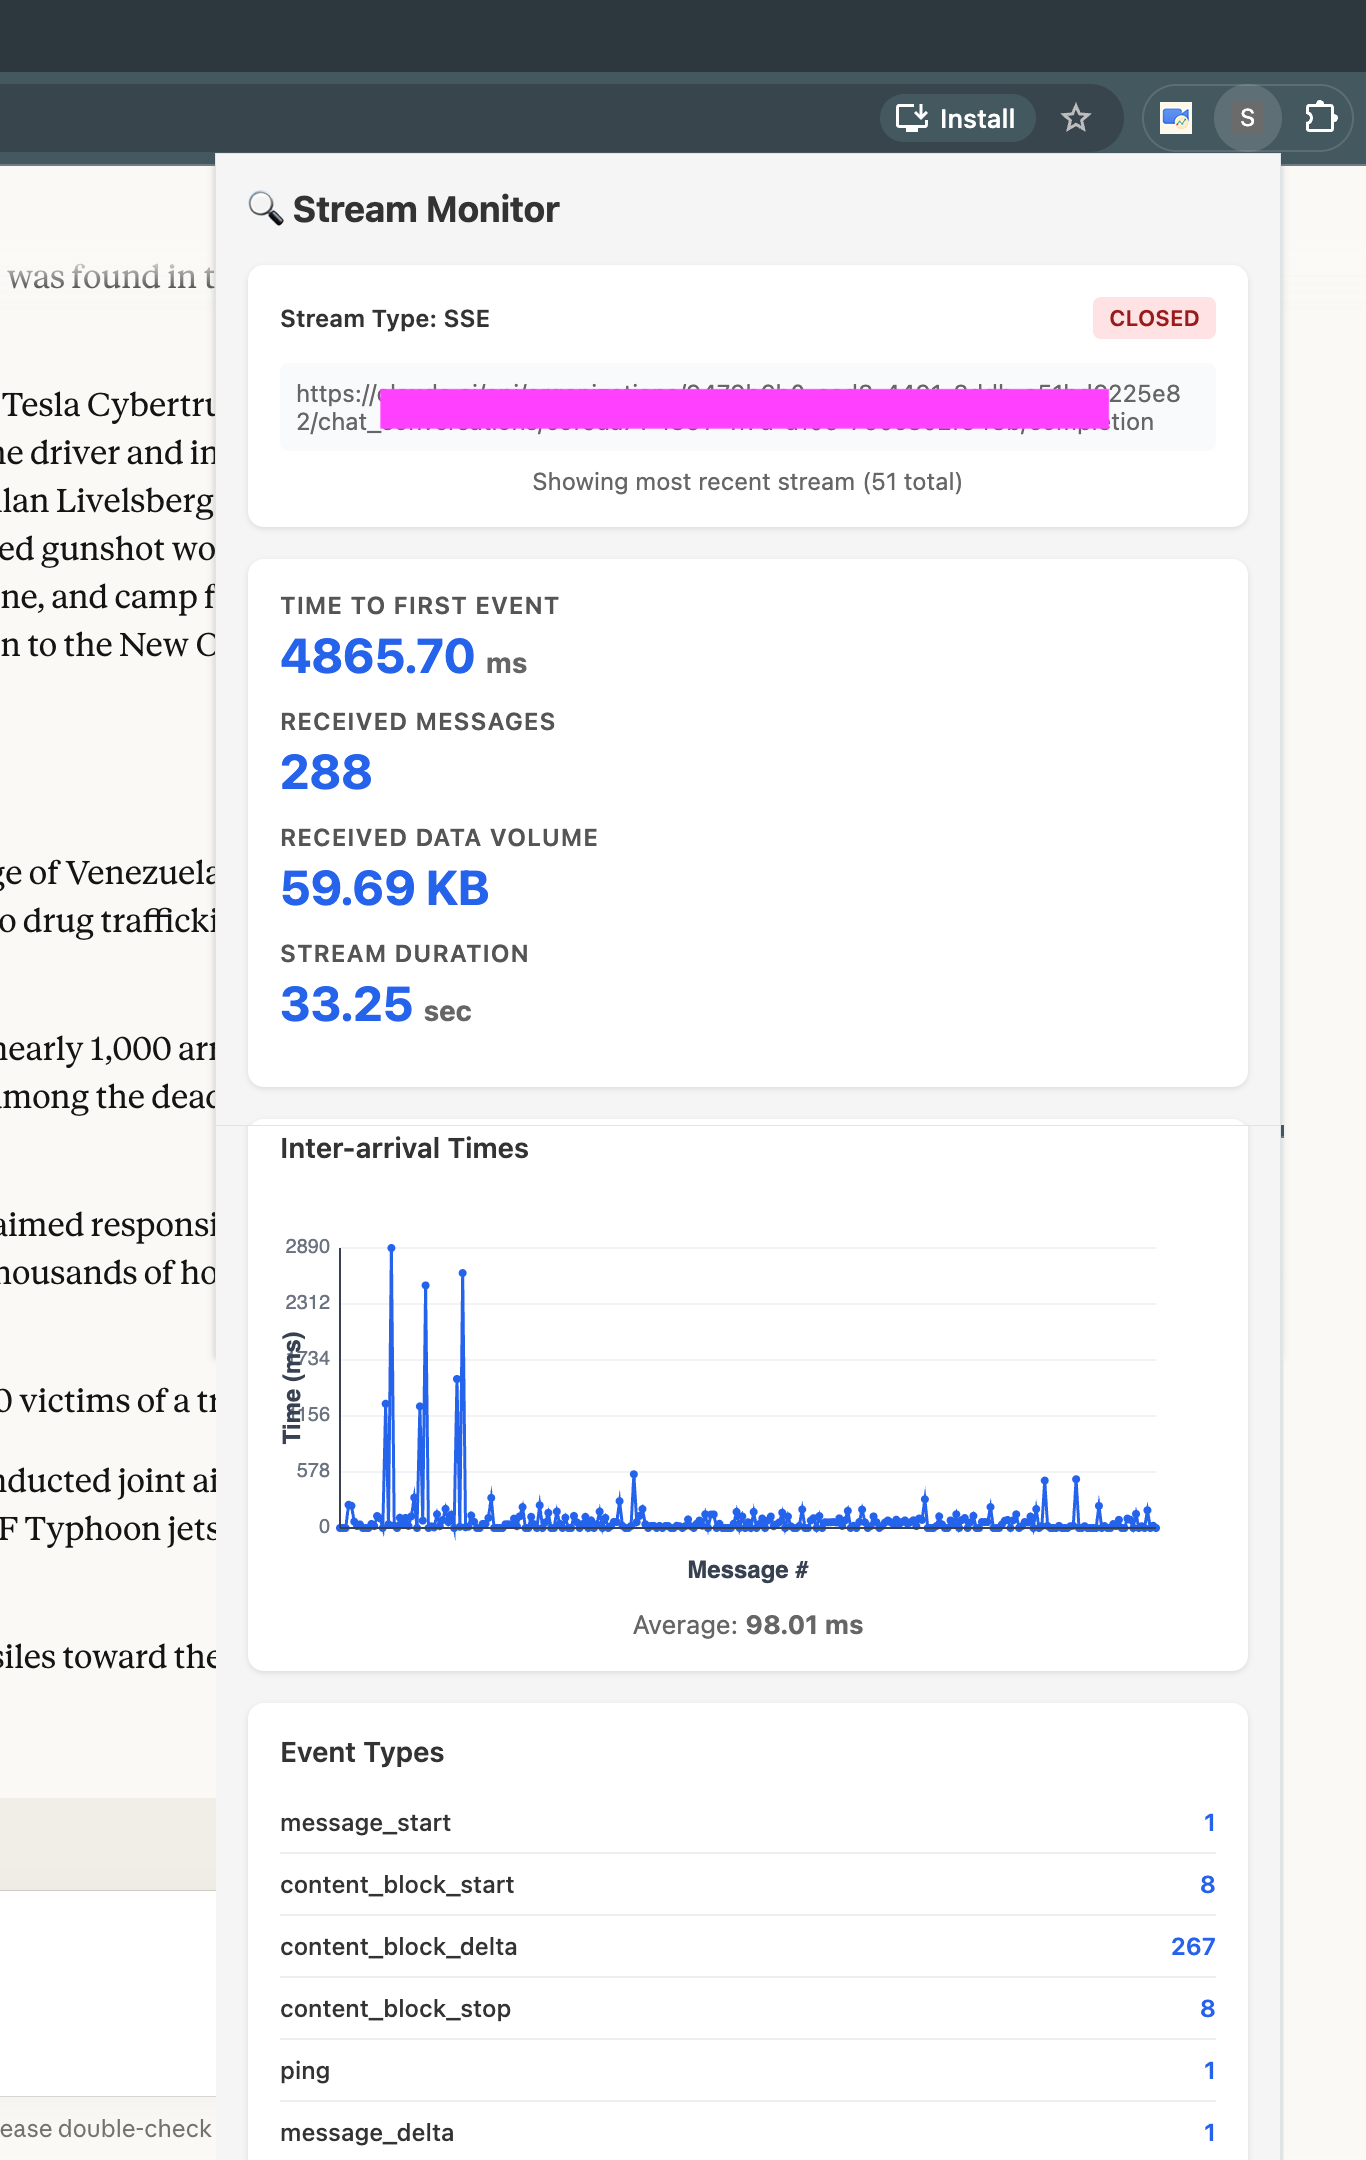
<p>Besides that, you could also whip up a basic browser plugin that checks for SSE, XHR, or WebSockets and grabs the initial metrics of the chatbot you’re using. I made one for myself, and it’s been a handy way to figure out whether the issue is with my network or the chatbot itself.<br />
<img src="/img/2026/01/Claude-AI.png" alt="" /></p>]]></content><author><name>Vandan</name><email>desai@vandan.co</email></author><category term="Product Management" /><category term="AI" /><category term="Observability" /><summary type="html"><![CDATA[Armed with nothing but Chrome's DevTools, you can now peek behind the curtain of your favorite AI Cahtbot and see exactly what's happening.]]></summary></entry><entry><title type="html">A Plan Is Not a Strategy</title><link href="https://vandan.co/2025/11/09/a-plan-is-not-a-strategy/" rel="alternate" type="text/html" title="A Plan Is Not a Strategy" /><published>2025-11-09T00:00:00+00:00</published><updated>2025-11-09T00:00:00+00:00</updated><id>https://vandan.co/2025/11/09/a-plan-is-not-a-strategy</id><content type="html" xml:base="https://vandan.co/2025/11/09/a-plan-is-not-a-strategy/"><![CDATA[<h2 id="planning">Planning</h2>

<ul>
  <li>You control costs.</li>
  <li>You’re the customer.</li>
  <li>It’s comfortable. 🙂</li>
</ul>

<h2 id="strategy">Strategy</h2>

<ul>
  <li>Actual customers are the customer.</li>
  <li>You don’t control them.</li>
  <li>You don‘t control revenues. 😬</li>
</ul>]]></content><author><name>Vandan</name><email>desai@vandan.co</email></author><category term="Product" /><category term="Management" /><summary type="html"><![CDATA[A comprehensive plan—with goals, initiatives, and budgets–is comforting. But starting with a plan is a terrible way to make strategy. Roger Martin, former dean of the Rotman School of Management at the University of Toronto.]]></summary></entry><entry><title type="html">Skyscraper Symphony – A Sunset Panorama of Midtown Manhattan</title><link href="https://vandan.co/2025/05/27/skyscraper-symphony-a-sunset-panorama-of-midtown-manhattan/" rel="alternate" type="text/html" title="Skyscraper Symphony – A Sunset Panorama of Midtown Manhattan" /><published>2025-05-27T00:00:00+00:00</published><updated>2025-05-27T00:00:00+00:00</updated><id>https://vandan.co/2025/05/27/skyscraper-symphony-a-sunset-panorama-of-midtown-manhattan</id><content type="html" xml:base="https://vandan.co/2025/05/27/skyscraper-symphony-a-sunset-panorama-of-midtown-manhattan/"><![CDATA[<p>There’s something undeniably magnetic about the New York City skyline — a vertical symphony of ambition, history, and unrelenting motion.</p>

<p>The Empire State Building anchors the center of the image, a familiar silhouette against a dynamic sky. Around it, glass towers rise like digital mountains — One Vanderbilt stretching skyward to the left, and the futuristic faces of Hudson Yards to the right. Each building, a chapter in the city’s ever-unfolding story.</p>

<p>Standing at this vantage point a decade back; the view was very different. Definitely a lot of cranes. They have all gone but one remains.</p>

<p>Urban landscapes aren’t just about buildings — they’re about energy. Even in stillness, New York buzzes.</p>]]></content><author><name>Vandan</name><email>desai@vandan.co</email></author><category term="Photography" /><category term="Landscapes" /><category term="New York" /><summary type="html"><![CDATA[A breathtaking panoramic view of Midtown Manhattan at sunset — from the iconic Empire State Building to the modern marvels of Hudson Yards, this photo captures the quiet majesty of New York City’s skyline in a rare moment of stillness.]]></summary><media:thumbnail xmlns:media="http://search.yahoo.com/mrss/" url="https://vandan.co/img/2025/05/5O0A1615-Pano-Enhanced-NR-Edit-1.jpg" /><media:content medium="image" url="https://vandan.co/img/2025/05/5O0A1615-Pano-Enhanced-NR-Edit-1.jpg" xmlns:media="http://search.yahoo.com/mrss/" /></entry><entry><title type="html">Princeton University</title><link href="https://vandan.co/2025/04/26/princeton-university/" rel="alternate" type="text/html" title="Princeton University" /><published>2025-04-26T00:00:00+00:00</published><updated>2025-04-26T00:00:00+00:00</updated><id>https://vandan.co/2025/04/26/princeton-university</id><content type="html" xml:base="https://vandan.co/2025/04/26/princeton-university/"><![CDATA[<p><img src="/img/2025/04/5O0A1323-Edit-Enhanced-SR.jpg" alt="" /></p>

<p><img src="/img/2025/04/5O0A1329-Edit-Enhanced-SR.jpg" alt="" /></p>

<p><img src="/img/2025/04/5O0A1336-Edit-Enhanced-SR.jpg" alt="" /></p>

<p>The chapel at Princeton University</p>

<hr />

<p><img src="/img/2025/04/5O0A1376-Edit-Edit.jpg" alt="" /></p>

<p><img src="/img/2025/04/5O0A1381.jpg" alt="" /></p>

<p><img src="/img/2025/04/5O0A1383.jpg" alt="" /></p>

<p>Cloistered Corridors at Princeton University</p>

<hr />

<p><img src="/img/2025/04/5O0A1309.jpg" alt="" /></p>

<p><img src="/img/2025/04/5O0A1320.jpg" alt="" /></p>

<p><img src="/img/2025/04/5O0A1361-1.jpg" alt="" /></p>

<p><img src="/img/2025/04/5O0A1352-1.jpg" alt="" /></p>

<hr />]]></content><author><name>Vandan</name><email>desai@vandan.co</email></author><category term="Photography" /><category term="Princeton University" /><summary type="html"><![CDATA[Wandering through the timeless beauty of Princeton University, where every corner whispers stories of tradition, knowledge, and inspiration. From historic halls to serene gardens, each snapshot captures the spirit of one of America’s most iconic campuses.]]></summary></entry><entry><title type="html">Effectively monitoring HTTP/2 Applications</title><link href="https://vandan.co/2024/11/14/monitoring-http-2-applications/" rel="alternate" type="text/html" title="Effectively monitoring HTTP/2 Applications" /><published>2024-11-14T00:00:00+00:00</published><updated>2024-11-14T00:00:00+00:00</updated><id>https://vandan.co/2024/11/14/monitoring-http-2-applications</id><content type="html" xml:base="https://vandan.co/2024/11/14/monitoring-http-2-applications/"><![CDATA[<p>In 2015, the <code class="language-plaintext highlighter-rouge">HTTP/2</code> protocol was introduced and developed based on Google’s SPDY, an experimental protocol for the web aimed at reducing the latency of web pages.</p>

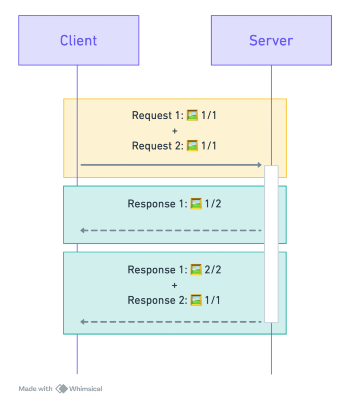
<p>Some of the key features of <code class="language-plaintext highlighter-rouge">HTTP/2</code> include the multiplexing of multiple messages within a single <code class="language-plaintext highlighter-rouge">TCP</code> packet and the use of a binary message format and <code class="language-plaintext highlighter-rouge">HPACK</code> compression for headers. To illustrate this, consider <code class="language-plaintext highlighter-rouge">HTTP/1.1</code>.
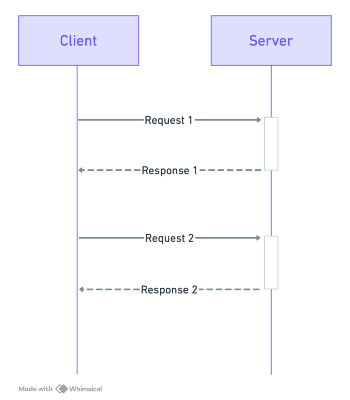
<img src="/img/2024/11/image-2.png" alt="" />
In the diagram, it is evident that two requests cannot be transmitted concurrently within the same <code class="language-plaintext highlighter-rouge">TCP</code> connection. This is because <code class="language-plaintext highlighter-rouge">HTTP/1.1</code> operates on a sequential basis, and request 2 cannot be sent until response 1 has been received. This phenomenon is known as <em>head-of-line blocking</em>.</p>
<p><code class="language-plaintext highlighter-rouge">HTTP/2</code> addresses this issue by using streams, which correspond to individual messages. Multiple streams can be interleaved within a single <code class="language-plaintext highlighter-rouge">TCP</code> packet. If a stream encounters a delay in transmitting its data, other streams can take its place in the <code class="language-plaintext highlighter-rouge">TCP</code> packet.</p>

<p><code class="language-plaintext highlighter-rouge">HTTP/2</code> streams are divided into <em>frames</em>, each containing the frame type, the stream it belongs to, and its byte length. In the diagram below, a colored rectangle represents a <code class="language-plaintext highlighter-rouge">TCP</code> packet, and a ✉ represents an <code class="language-plaintext highlighter-rouge">HTTP/2</code> frame within it. The first and third <code class="language-plaintext highlighter-rouge">TCP</code> packets contain frames from different streams.
<img src="/img/2024/11/image-1-1-1.png" alt="" /></p>
<h2 id="measuring-http2-application-performance">Measuring HTTP/2 application performance</h2>

<p>The most cost-effective way to measure response time and availability for <code class="language-plaintext highlighter-rouge">HTTP/2</code> applications is to use the <code class="language-plaintext highlighter-rouge">cURL</code> command-line tool. With <code class="language-plaintext highlighter-rouge">cURL</code>, the response time, also known as latency, refers to the time it takes to establish the connection and receive the first byte of the response (TTFB). To obtain response headers and timing metrics in a readable format, you can use the <code class="language-plaintext highlighter-rouge">-w</code> (write-out) option or create a simple configuration file. The configuration file can be downloaded from <a href="https://github.com/vandancd/CurlTester?ref=vandan.co">GitHub</a> and includes a formatted and readable representation of response headers and timing metrics.</p>

<p>To use <code class="language-plaintext highlighter-rouge">cURL</code> with <code class="language-plaintext highlighter-rouge">HTTP/2</code>, add the <code class="language-plaintext highlighter-rouge">--http2</code> option before the URL. For example, to test a URL like host.domain.com, use the following command:</p>

<div class="language-plaintext highlighter-rouge"><div class="highlight"><pre class="highlight"><code>curl -K curl.cfg &lt;host.domain.com&gt; --http2
</code></pre></div></div>

<p>When running with <code class="language-plaintext highlighter-rouge">HTTP/2</code>, you can still access the same timing variables that apply to <code class="language-plaintext highlighter-rouge">HTTP/1.x</code>, but the protocol will be <code class="language-plaintext highlighter-rouge">HTTP/2</code>.</p>

<p>As we learned earlier, <code class="language-plaintext highlighter-rouge">HTTP/2</code> supports multiplexing, which allows multiple streams to be active within a single connection. If you’re testing multiple requests over the same connection, curl won’t directly display stream-level latency. However, you can still measure individual request timings by executing multiple <code class="language-plaintext highlighter-rouge">cURL</code> invocations for different URLs or by measuring the overall connection’s multiplexing performance.</p>

<p><code class="language-plaintext highlighter-rouge">HTTP/2</code>’s primary performance advantage lies in its multiplexing feature, where multiple streams are handled simultaneously over a single <code class="language-plaintext highlighter-rouge">TCP</code> connection. Inefficient multiplexing can lead to inefficiencies, such as one stream slowing down others (head-of-line blocking) or a connection not fully utilizing its capacity.</p>

<p>To measure multiplexing efficiency using curl, you would need to <strong>execute multiple concurrent requests</strong> and observe the total connection time and performance under load.</p>

<div class="language-plaintext highlighter-rouge"><div class="highlight"><pre class="highlight"><code>curl —http2 https://example.com &amp;
curl —http2 https://example.com &amp;
</code></pre></div></div>

<p>However, this approach won’t provide detailed information about individual streams or their multiplexing behavior. For this purpose, specialized tools like <strong>Wireshark</strong><strong>are essential</strong> for protocol analysis.</p>

<h2 id="using-nghttp2">Using <a href="https://nghttp2.org">nghttp2</a></h2>

<p><strong><code class="language-plaintext highlighter-rouge">nghttp</code></strong>, a command-line tool part of the <code class="language-plaintext highlighter-rouge">**nghttp2**</code> project, is a versatile library and suite designed to work with the <code class="language-plaintext highlighter-rouge">HTTP/2</code> protocol. It offers users comprehensive control over various aspects of the protocol, including stream multiplexing, prioritization, and flow control.</p>

<p>Imagine you’re monitoring a web application that loads multiple assets like <code class="language-plaintext highlighter-rouge">CSS</code>, <code class="language-plaintext highlighter-rouge">JS</code>, and <code class="language-plaintext highlighter-rouge">images</code>. Despite using <code class="language-plaintext highlighter-rouge">HTTP/2</code>, you notice inconsistent or slow page load times. <code class="language-plaintext highlighter-rouge">nghttp</code> can help you identify the issue.</p>

<p>To test multiplexing, run nghttp with multiple URLs and observe the performance.</p>

<div class="language-plaintext highlighter-rouge"><div class="highlight"><pre class="highlight"><code>nghttp -v -s https://example.com/style.css https://example.com/script.js https://example.com/image.jpg
</code></pre></div></div>

<p>Analyze the connection logs to check if requests are truly multiplexed or if streams are waiting for each other.</p>

<p>If multiplexing isn’t efficient (e.g., only one stream seems active), it could indicate a server-side issue where the server isn’t handling multiple streams correctly. Check the server’s configuration to see if it limits the number of concurrent streams.</p>

<p>By identifying whether multiplexing works as expected, you can adjust server settings or investigate bottlenecks related to network congestion or server capacity.</p>

<p>When you run the <code class="language-plaintext highlighter-rouge">nghttp</code> command, the very first line in the output will look something like this:</p>

<div class="language-plaintext highlighter-rouge"><div class="highlight"><pre class="highlight"><code>[ 0.037] Connected
</code></pre></div></div>

<p>This indicates that <code class="language-plaintext highlighter-rouge">nghttp</code> successfully established a connection to the server, and it took <strong><code class="language-plaintext highlighter-rouge">0.037 seconds</code></strong> (37 milliseconds) to do so. This “Connected” time typically includes <strong>DNS Resolution Time</strong> (if not cached); <strong>TCP Connection Time</strong> &amp; <strong>TLS/SSL Handshake Time</strong> (if HTTPS).</p>

<p><code class="language-plaintext highlighter-rouge">nghttp</code> does not separate these components; it combines them into a single “Connected” time. For a more detailed breakdown (DNS, TCP, and SSL times separately), you would need to use <code class="language-plaintext highlighter-rouge">cURL</code>.</p>

<p>Since <code class="language-plaintext highlighter-rouge">HTTP/2</code> does this once, and reuses for subsequent requests, you would need to do a <code class="language-plaintext highlighter-rouge">cURL</code> on the first URL to get the timing metrics independently.</p>

<hr />

<p>When running <code class="language-plaintext highlighter-rouge">nghttp</code>, the output will contain detailed information about the <code class="language-plaintext highlighter-rouge">HTTP/2</code> session and streams for each URL requested.  At first the output would look alien if you are using to <code class="language-plaintext highlighter-rouge">cURL</code>. Here is a simple way to breakdown the key parts of the output:</p>

<p><strong>Session Initiation</strong></p>

<ul>
  <li><code class="language-plaintext highlighter-rouge">Connecting to...</code> will show the IP address and port being used.</li>
  <li>If <code class="language-plaintext highlighter-rouge">https</code> is being used, <code class="language-plaintext highlighter-rouge">nghttp</code> will perform a TLS handshake and display the details about the cipher suite, protocol, version, and certificate.</li>
</ul>

<p><strong>Stream Information</strong>: Each URL requested is assigned a <strong>stream ID</strong>. In <code class="language-plaintext highlighter-rouge">HTTP/2</code>, multiple streams allow for multiplexing, so each resource (CSS, JS, JPG) will have a unique stream ID – typically starting with an odd number and incrementing with  each request.</p>

<div class="language-plaintext highlighter-rouge"><div class="highlight"><pre class="highlight"><code>[id=1] [id=3] [id=5]
</code></pre></div></div>

<p><strong>Request Headers</strong> will display in detail:</p>

<ul>
  <li><code class="language-plaintext highlighter-rouge">**:method**:</code> Shows the <code class="language-plaintext highlighter-rouge">HTTP</code> method (usually GET).</li>
  <li><code class="language-plaintext highlighter-rouge">**:scheme**:</code> Indicates the scheme (typically https for secure connections).</li>
  <li><code class="language-plaintext highlighter-rouge">**:path**:</code> The path to the requested resource (/style.css, /script.js, /image.jpg).</li>
  <li><code class="language-plaintext highlighter-rouge">**:authority**:</code> The hostname (e.g., example.com).</li>
</ul>

<p>These headers are part of the <code class="language-plaintext highlighter-rouge">HTTP/2</code> protocol and help the server understand each request’s method, path, and target.</p>

<p><strong>Response Headers</strong>: Each response will also have headers associated with it, including:</p>

<ul>
  <li><code class="language-plaintext highlighter-rouge">**:status**:</code> The <code class="language-plaintext highlighter-rouge">HTTP</code> status code, such as <code class="language-plaintext highlighter-rouge">200</code> for success, <code class="language-plaintext highlighter-rouge">404</code> for not found, etc.</li>
  <li>Other headers, like content-type (e.g., text/css, application/javascript, image/jpeg) and content-length.</li>
</ul>

<p><strong>Stream Timing Metrics</strong>: This is where things get very interesting</p>

<ul>
  <li><strong><code class="language-plaintext highlighter-rouge">[id=X] [END_STREAM]</code></strong>: This marks the end of data transmission on a specific stream, indicating the resource download is complete.</li>
  <li><strong>Timing Information</strong>: For each stream, <code class="language-plaintext highlighter-rouge">nghttp</code> provides basic timing information, including:</li>
  <li><strong>First byte time</strong>: The time taken to receive the first byte.</li>
  <li><strong>Completion time</strong>: The time at which the full content was received.</li>
</ul>

<p>These times can help you see how quickly each resource loads and identify potential bottlenecks.</p>

<p><strong>Summary of Multiplexing</strong>: When you use the <code class="language-plaintext highlighter-rouge">-s</code> flag, at the end of the output the statistical summary of all the three resources will be displayed.</p>

<ul>
  <li>Since all requests run concurrently, <code class="language-plaintext highlighter-rouge">nghttp</code> may indicate how the streams are interleaved. Multiplexing lets <code class="language-plaintext highlighter-rouge">nghttp</code> download <code class="language-plaintext highlighter-rouge">style.css</code>, <code class="language-plaintext highlighter-rouge">script.js</code>, and <code class="language-plaintext highlighter-rouge">image.jpg</code> simultaneously over the same connection.</li>
  <li>This section is especially useful for understanding how well the server handles concurrent <code class="language-plaintext highlighter-rouge">HTTP/2</code> requests and if any stream experiences noticeable delays.</li>
</ul>

<p>Here is a sample output of the statistics:</p>

<div class="language-plaintext highlighter-rouge"><div class="highlight"><pre class="highlight"><code>***** Statistics *****

Request timing:
  responseEnd: the  time  when  last  byte of  response  was  received
               relative to connectEnd
 requestStart: the time  just before  first byte  of request  was sent
               relative  to connectEnd.   If  '*' is  shown, this  was
               pushed by server.
      process: responseEnd - requestStart
         code: HTTP status code
         size: number  of  bytes  received as  response  body  without
               inflation.
          URI: request URI

see http://www.w3.org/TR/resource-timing/#processing-model

sorted by 'complete'

id  responseEnd requestStart  process code size request path
 15    +17.75ms       +179us  17.57ms  200   7K /jpeg/2023/03/me.jpg
 17   +164.68ms       +256us 164.42ms  200  17K /assets/built/main.min.js
 13   +165.11ms       +153us 164.96ms  200   7K /assets/built/screen.css
</code></pre></div></div>

<hr />

<p>To effectively monitor <code class="language-plaintext highlighter-rouge">HTTP/2</code> based applications, it’s essential to test multiple URLs as part of the same transaction. This allows you to assess how efficiently the server handles multiplexing, where multiple streams are sent over a single connection simultaneously. By using multiple URLs, you can evaluate key <code class="language-plaintext highlighter-rouge">HTTP/2</code> features such as stream prioritization and flow control, which optimize resource delivery and responsiveness. Monitoring these metrics helps identify performance bottlenecks, detect inefficient resource allocation, and ensure that your application is leveraging the full benefits of HTTP/2 for improved user experience.</p>]]></content><author><name>Vandan</name><email>desai@vandan.co</email></author><category term="Product" /><category term="Product Management" /><category term="Observability" /><category term="o11y" /><summary type="html"><![CDATA[HTTP/2’s primary performance advantage lies in its multiplexing feature, where multiple streams are handled simultaneously over a single TCP connection. Inefficient multiplexing can lead to inefficiencies. It's important to use the right tools and strategy for HTTP/2 applications.]]></summary><media:thumbnail xmlns:media="http://search.yahoo.com/mrss/" url="https://vandan.co/img/2024/11/Firefly-a-modern-web-browser-30366.jpg" /><media:content medium="image" url="https://vandan.co/img/2024/11/Firefly-a-modern-web-browser-30366.jpg" xmlns:media="http://search.yahoo.com/mrss/" /></entry></feed>