User Experience (UX) Metrics for Product Managers using RUM
RUM has been around ever since I started my first job (well over 20 years I recon) and the issue I fell is that people still don’t realize how best to utilize RUM.
A while back I wrote an article about User Experience Metrics for Product Managers along with their hundred other KPI’s they keep track of. These specifically focused on how the product would perform on a user’s browser with tools like Google Puppeteer.
One of the things we product managers always want to track (and also struggle with) is how new features or services impact customers. Worst, what good product performance/experience means is never established be it web, table or mobile.
When I started out as a product manager, I didn’t even know how to benchmark user experience, but knew very well what the term user experience meant. To get a good understanding on user experience, I took up a job as a UX Designer for 3 years and although that was more focused on designing the right product for the person benchmarking or tracking any kind of UX metric was never a priority.
When pressed hard on user experience most organizations tend to solely rely on uptime and response time as two standard metrics to report on the success or failure of a new product, feature or a service.
RUM has been around ever since I started my first job (well over 20 years I recon) and the issue I fell is that people still don’t realize how best to utilize RUM.
I see product managers using RUM data to identify the different screen resolutions, or the most common browser being used and what part of the world is your user base coming from. Trust me, RUM can do a lot more than just that and provide you with valuable information about our product’s user experience and performance.
In 2020, Google announced Core Web Vitals as part of the Page Experience update. The findings that lead to these core web vitals weren’t surprising.
Speed matters - your web application should load smoothly and quickly. Jakob Nielson at the NN/g explains this very well in his article about the 3 important limits for response times.
0.1 second is about the limit for having the user feel that the system is reacting instantaneously, meaning that no special feedback is necessary except to display the result.
1.0 second is about the limit for the user's flow of thought to stay uninterrupted, even though the user will notice the delay. Normally, no special feedback is necessary during delays of more than 0.1 but less than 1.0 second, but the user does lose the feeling of operating directly on the data.
10 seconds is about the limit for keeping the user's attention focused on the dialogue. For longer delays, users will want to perform other tasks while waiting for the computer to finish, so they should be given feedback indicating when the computer expects to be done. Feedback during the delay is especially important if the response time is likely to be highly variable, since users will then not know what to expect.
Lets look at the three core web vitals that Google proposes:
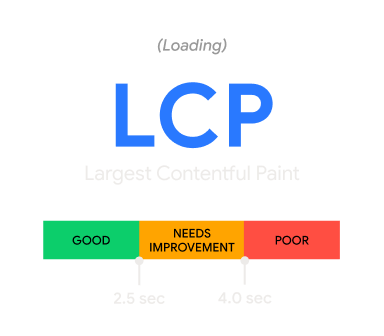
Largest Contentful Paint (LCP): measures loading performance. To provide a good user experience, LCP should occur within 2.5 seconds of when the page first starts loading.

This is measuring your websites loading performance. How quickly your images are loading. To get a better score, make sure your images are optimized.
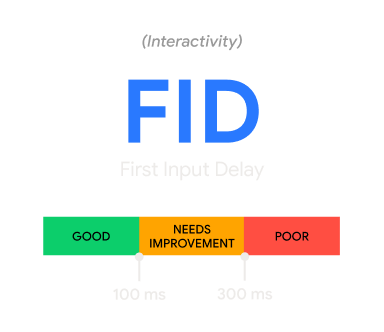
First Input Delay (FID): measures interactivity. To provide a good user experience, pages should have a FID of 100 milliseconds or less.

This is measuring the interactivity of your website. How quickly is your website able to accept user input. Think about it, your users are using your applications for a very long time. At a certain point they have built motor skills where they know on the browser a button or dropdown is going to be and their mouse just gravitates to that spot. Prioritizing your items to be loaded and made interactive as soon as possible will allow users to get less frustrated and improve your user experience.
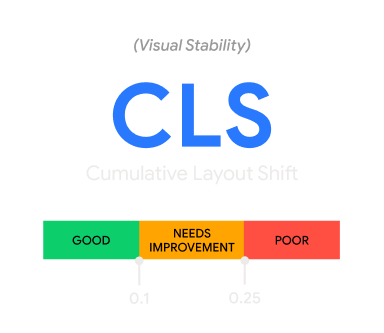
Cumulative Layout Shift (CLS): measures visual stability. To provide a good user experience, pages should maintain a CLS of 0.1. or less.

Visual Stability is very important. How often has it happened when you are reading a message and suddenly the page shifts because an ad loaded and its taking up more space now. Make sure your interface is set up to incorporate for those spaces as they fill up over time.
What I like about these core web vitals is that it provides a standard benchmark. This now makes it easy for you compare your core web vital performance against this benchmark.
The core web vital measures a few things that is essential to determine the user experience. It measures
- how fast a user can interact with your website or mobile application
- how quickly the content loads
The quicker that image loads the better user experience and a good web vitals score. We have come along way on this internet journey. Today the user expects the content to be loaded or at least the website to be interactive in under 4 seconds. Our attention span has grown shorter over the years. Anything longer and we move on or just get frustrated with the experience.
Have you hit refresh or a link multiple times? Back in the day, after entering the url or clicking a hyperlink, you could sit back and wait until the page loaded - and that was the expected experience. Today you are guaranteed to receive a few extra key strokes or mouse clicks if things don’t load faster.
Core Web Vitals are one of the most effective way to quantify user experience. And RUM is so versatile that these metrics and data can be used by anyone in your organization - be it Product Managers, Marketing Team, Engineering or Site Reliability Engineers.


