Effectively monitoring HTTP/2 Applications
HTTP/2’s primary performance advantage lies in its multiplexing feature, where multiple streams are handled simultaneously over a single TCP connection. Inefficient multiplexing can lead to inefficiencies. It's important to use the right tools and strategy for HTTP/2 applications.

In 2015, the HTTP/2 protocol was introduced and developed based on Google’s SPDY, an experimental protocol for the web aimed at reducing the latency of web pages.
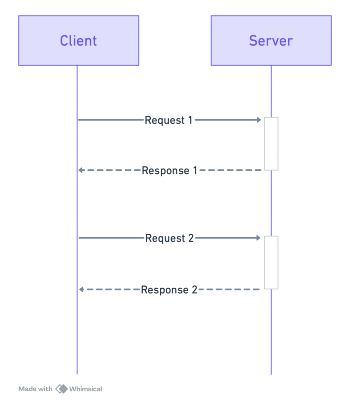
Some of the key features of HTTP/2 include the multiplexing of multiple messages within a single TCP packet and the use of a binary message format and HPACK compression for headers. To illustrate this, consider HTTP/1.1.

In the diagram, it is evident that two requests cannot be transmitted concurrently within the same TCP connection. This is because HTTP/1.1 operates on a sequential basis, and request 2 cannot be sent until response 1 has been received. This phenomenon is known as head-of-line blocking.
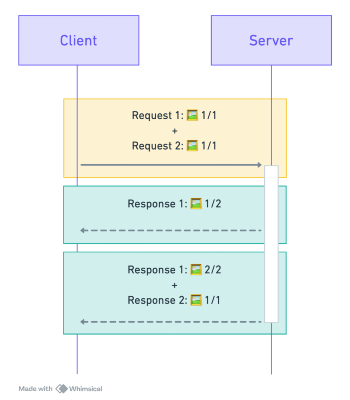
HTTP/2 addresses this issue by using streams, which correspond to individual messages. Multiple streams can be interleaved within a single TCP packet. If a stream encounters a delay in transmitting its data, other streams can take its place in the TCP packet.
HTTP/2 streams are divided into frames, each containing the frame type, the stream it belongs to, and its byte length. In the diagram below, a colored rectangle represents a TCP packet, and a ✉ represents an HTTP/2 frame within it. The first and third TCP packets contain frames from different streams.

Measuring HTTP/2 application performance
The most cost-effective way to measure response time and availability for HTTP/2 applications is to use the cURL command-line tool. With cURL, the response time, also known as latency, refers to the time it takes to establish the connection and receive the first byte of the response (TTFB). To obtain response headers and timing metrics in a readable format, you can use the -w (write-out) option or create a simple configuration file. The configuration file can be downloaded from GitHub and includes a formatted and readable representation of response headers and timing metrics.
To use cURL with HTTP/2, add the --http2 option before the URL. For example, to test a URL like host.domain.com, use the following command:
curl -K curl.cfg <host.domain.com> --http2When running with HTTP/2, you can still access the same timing variables that apply to HTTP/1.x, but the protocol will be HTTP/2.
As we learned earlier, HTTP/2 supports multiplexing, which allows multiple streams to be active within a single connection. If you’re testing multiple requests over the same connection, curl won’t directly display stream-level latency. However, you can still measure individual request timings by executing multiple cURL invocations for different URLs or by measuring the overall connection’s multiplexing performance.
HTTP/2’s primary performance advantage lies in its multiplexing feature, where multiple streams are handled simultaneously over a single TCP connection. Inefficient multiplexing can lead to inefficiencies, such as one stream slowing down others (head-of-line blocking) or a connection not fully utilizing its capacity.
To measure multiplexing efficiency using curl, you would need to execute multiple concurrent requests and observe the total connection time and performance under load.
curl —http2 https://example.com &
curl —http2 https://example.com &
curl —http2 https://example.com &
However, this approach won’t provide detailed information about individual streams or their multiplexing behavior. For this purpose, specialized tools like Wireshark are essential for protocol analysis.
Using nghttp2
nghttp, a command-line tool part of the nghttp2 project, is a versatile library and suite designed to work with the HTTP/2 protocol. It offers users comprehensive control over various aspects of the protocol, including stream multiplexing, prioritization, and flow control.
Imagine you’re monitoring a web application that loads multiple assets like CSS, JS, and images. Despite using HTTP/2, you notice inconsistent or slow page load times. nghttp can help you identify the issue.
To test multiplexing, run nghttp with multiple URLs and observe the performance.
nghttp -v -s https://example.com/style.css https://example.com/script.js https://example.com/image.jpgAnalyze the connection logs to check if requests are truly multiplexed or if streams are waiting for each other.
If multiplexing isn’t efficient (e.g., only one stream seems active), it could indicate a server-side issue where the server isn’t handling multiple streams correctly. Check the server’s configuration to see if it limits the number of concurrent streams.
By identifying whether multiplexing works as expected, you can adjust server settings or investigate bottlenecks related to network congestion or server capacity.
When you run the nghttp command, the very first line in the output will look something like this:
[ 0.037] ConnectedThis indicates that nghttp successfully established a connection to the server, and it took 0.037 seconds (37 milliseconds) to do so. This “Connected” time typically includes DNS Resolution Time (if not cached); TCP Connection Time & TLS/SSL Handshake Time (if HTTPS).
nghttp does not separate these components; it combines them into a single “Connected” time. For a more detailed breakdown (DNS, TCP, and SSL times separately), you would need to use cURL.
Since HTTP/2 does this once, and reuses for subsequent requests, you would need to do a cURL on the first URL to get the timing metrics independently.
When running nghttp, the output will contain detailed information about the HTTP/2 session and streams for each URL requested. At first the output would look alien if you are using to cURL. Here is a simple way to breakdown the key parts of the output:
Session Initiation
Connecting to...will show the IP address and port being used.- If
httpsis being used,nghttpwill perform a TLS handshake and display the details about the cipher suite, protocol, version, and certificate.
Stream Information: Each URL requested is assigned a stream ID. In HTTP/2, multiple streams allow for multiplexing, so each resource (CSS, JS, JPG) will have a unique stream ID – typically starting with an odd number and incrementing with each request.
[id=1] [id=3] [id=5]Request Headers will display in detail:
:method:Shows theHTTPmethod (usually GET).:scheme:Indicates the scheme (typically https for secure connections).:path:The path to the requested resource (/style.css, /script.js, /image.jpg).:authority:The hostname (e.g., example.com).
These headers are part of the HTTP/2 protocol and help the server understand each request’s method, path, and target.
Response Headers: Each response will also have headers associated with it, including:
:status:TheHTTPstatus code, such as200for success,404for not found, etc.- Other headers, like content-type (e.g., text/css, application/javascript, image/jpeg) and content-length.
Stream Timing Metrics: This is where things get very interesting
[id=X] [END_STREAM]: This marks the end of data transmission on a specific stream, indicating the resource download is complete.- Timing Information: For each stream,
nghttpprovides basic timing information, including:- First byte time: The time taken to receive the first byte.
- Completion time: The time at which the full content was received.
These times can help you see how quickly each resource loads and identify potential bottlenecks.
Summary of Multiplexing: When you use the -s flag, at the end of the output the statistical summary of all the three resources will be displayed.
- Since all requests run concurrently,
nghttpmay indicate how the streams are interleaved. Multiplexing letsnghttpdownloadstyle.css,script.js, andimage.jpgsimultaneously over the same connection. - This section is especially useful for understanding how well the server handles concurrent
HTTP/2requests and if any stream experiences noticeable delays.
Here is a sample output of the statistics:
***** Statistics *****

Request timing:
  responseEnd: the  time  when  last  byte of  response  was  received
               relative to connectEnd
 requestStart: the time  just before  first byte  of request  was sent
               relative  to connectEnd.   If  '*' is  shown, this  was
               pushed by server.
      process: responseEnd - requestStart
         code: HTTP status code
         size: number  of  bytes  received as  response  body  without
               inflation.
          URI: request URI

see http://www.w3.org/TR/resource-timing/#processing-model

sorted by 'complete'

id  responseEnd requestStart  process code size request path
 15    +17.75ms       +179us  17.57ms  200   7K /jpeg/2023/03/me.jpg
 17   +164.68ms       +256us 164.42ms  200  17K /assets/built/main.min.js
 13   +165.11ms       +153us 164.96ms  200   7K /assets/built/screen.css
To effectively monitor HTTP/2 based applications, it’s essential to test multiple URLs as part of the same transaction. This allows you to assess how efficiently the server handles multiplexing, where multiple streams are sent over a single connection simultaneously. By using multiple URLs, you can evaluate key HTTP/2 features such as stream prioritization and flow control, which optimize resource delivery and responsiveness. Monitoring these metrics helps identify performance bottlenecks, detect inefficient resource allocation, and ensure that your application is leveraging the full benefits of HTTP/2 for improved user experience.


