An AI answer stops halfway through a sentence, and nothing moves for eight seconds. Over an encrypted stream, a model thinking and a network stall look exactly the same: no bytes are arriving. Somebody still has to decide whose pause it was.
In my first post I said watson attributes each pause to the network, the machine or the provider. I skipped how, and that’s the part most likely to be wrong, so this post is about the rules.
The problem
Most tools give you one number for a pause, the time nothing arrived. That number can’t tell you what to do next. If the pause was your Wi-Fi, you move closer to the router. If the provider was working, you wait or switch models. If a local tool was running, the delay was probably the work you asked for.
Guessing wrong has a cost too. My first instinct when an AI session felt slow was to blame the network and restart things. As you’ll see in the data below, the network almost never explained the pause.
The obvious way to find out is to read the stream and look for thinking events. watson doesn’t do that. It never decrypts anything, so a pause has to be explained by what else was happening at the time.
How watson solves it
A silent period is any gap of more than a second between downstream arrivals inside a response. For each one, watson collects evidence from around that gap and takes the first rule that matches.
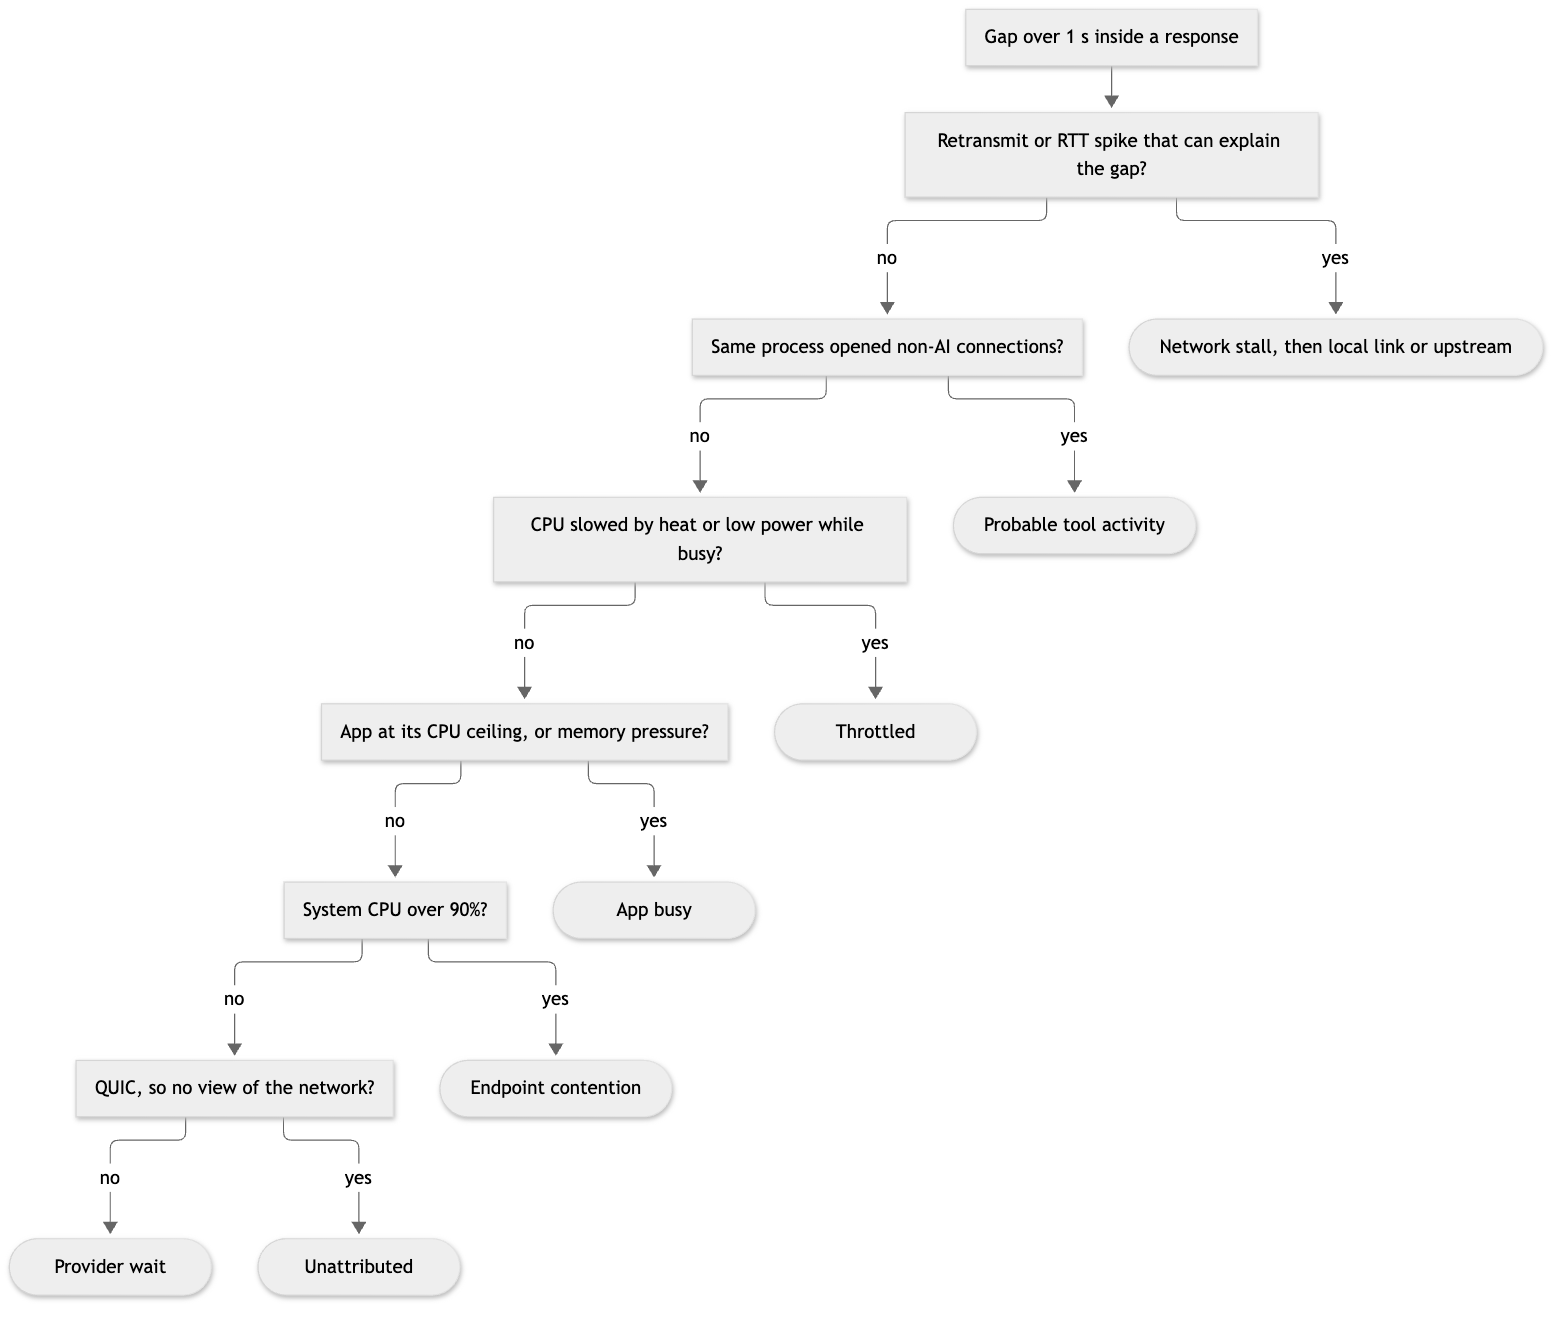
Provider wait comes last on purpose. It means nothing else explained the pause and the network looked healthy. watson’s own reason string for it is “network healthy; provider or tool is working”. It never lowers the score.
Two of these rules exist because the simple version was wrong on real traffic.
The first is the RTT spike. A spike only counts as a stall if it’s at least twice the connection’s minimum, at least 50 ms above it, and large enough to explain the pause: the extra delay has to be at least a quarter of the gap. Before that last condition, a 150 ms blip from Wi-Fi waking up after idle could get a 10 second silence labelled as a network stall.
The second is the retransmit. A retransmit during a pause used to be enough to call it a stall, and thinking pauses before the first token were getting blamed on the network. Now a retransmit at the pause’s very first instant, or one that only repeats bytes the client already had, doesn’t count as loss evidence.
The QUIC branch is the one where watson admits defeat. QUIC encrypts its transport headers, so there are no retransmits or round trips to read. Calling those pauses provider wait would be a claim watson can’t back up, so they stay unattributed, unless a router ping during the gap shows the first hop misbehaving.
Here is a real turn from my machine on November 5, from Claude Code:
| Value | Normal | |
|---|---|---|
| Wall clock | 145.6 s | |
| Time on the wire | 138.1 s | |
| Slowest first byte | 7.84 s | 649 ms |
| Round trip | 19.5 ms | 20.0 ms |
| Tool activity | 58.2 s | |
| Provider wait | 30.2 s |
The first byte took twelve times longer than usual, and the round trip didn’t change at all, so the network looks fine. System CPU did peak at 97% during that turn, which the page shows as a condition. No other app was active, so the scope reads alone and adds nothing either way.
Troubleshooting steps
When a session feels slow, this is the order I use.
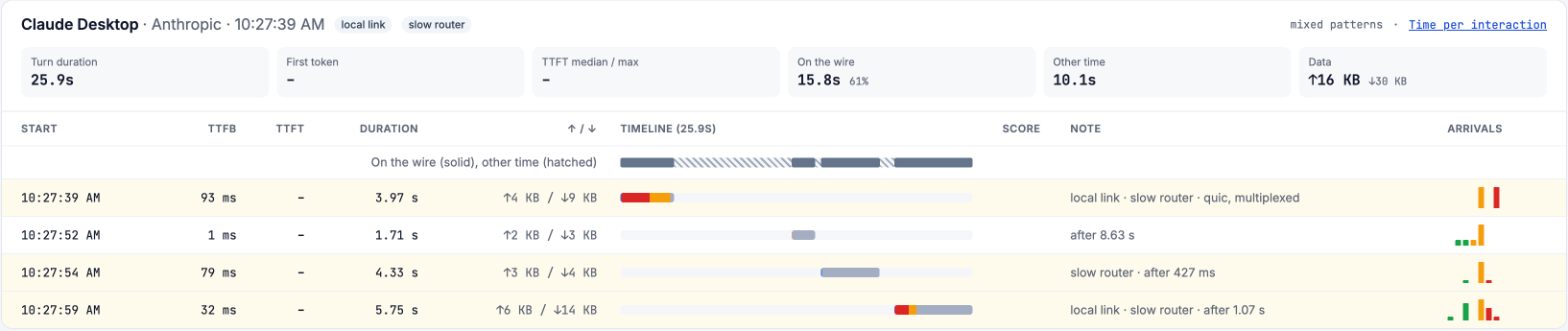
- Open the Overview page and find the turn. Look at the split between time on the wire and “other”. If most of it is other, nothing was on the network: local tools, thinking or waiting for you. The wire can’t tell those three apart.
- Read the SILENT column.
1N 2Pmeans one network stall and two provider waits. If it’s allP, stop looking at your network. - If you see
N,LorU, the stall happened on the path.Lis your Wi-Fi or router andUis somewhere past it. - If you see
T, a local tool was probably running. The T rule is a heuristic, and it misses very short connections. - If you see
?, the stream was QUIC and watson can’t tell. Treat that as unknown, because it’s not evidence of a healthy network. - Check the scope on the page. “Several apps” points at the machine or your link. “Same provider” is ambiguous. “This app only” points away from your link.
To total your own history by cause:
jq -r '.silent_periods[]? | [.class, .duration_ms] | @tsv' ~/.watson/records.jsonl \
  | awk '{t[$1]+=$2} END {for (c in t) printf "%-22s %8.0f s\n", c, t[c]/1000}' \
  | sort -k2 -nr
Metrics in focus
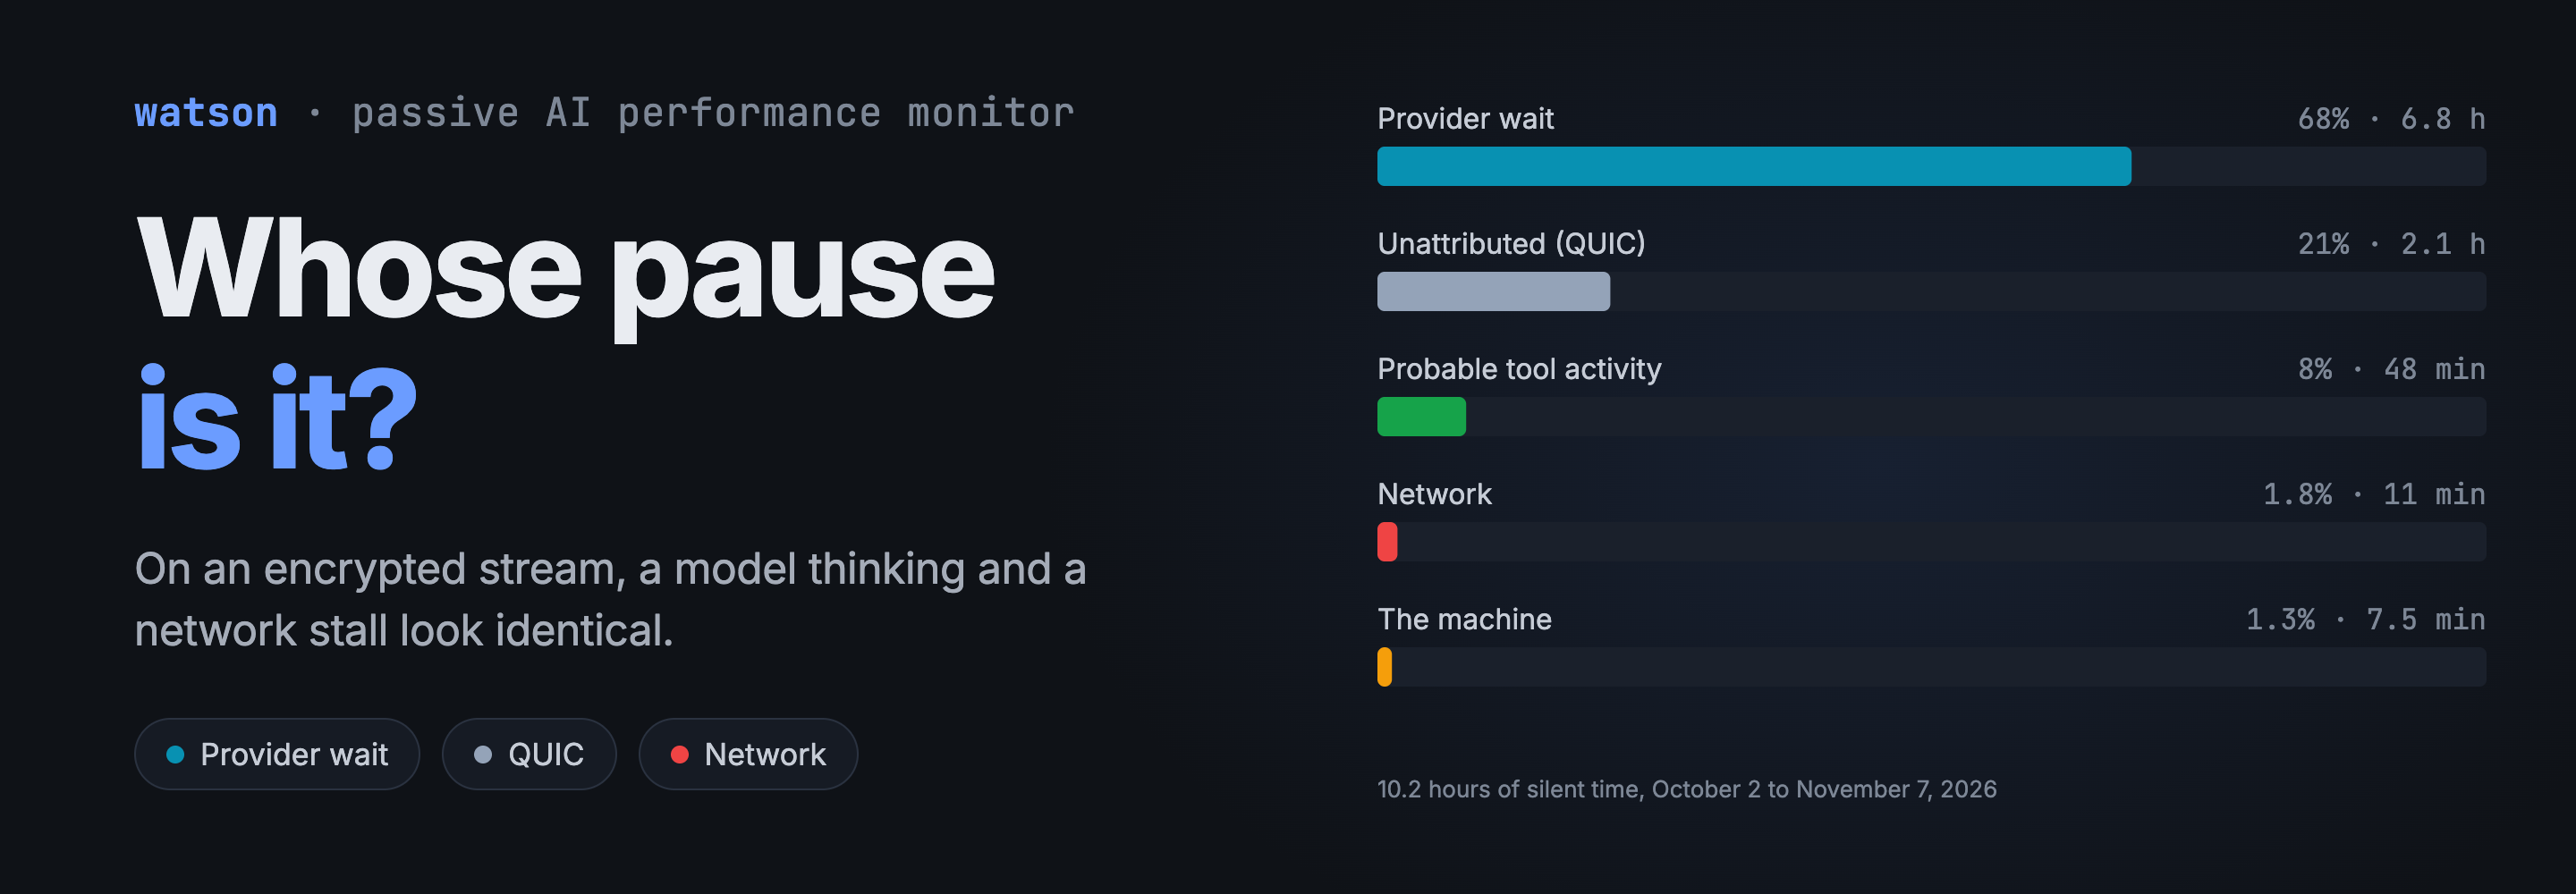
These are the figures for pauses, from five weeks of my own log (October 2 to November 7, 2026). That’s 14,884 timed records, of which 12,661 are Claude Code, and about 10.2 hours of silent time.
| Cause | Pauses | Time | Share |
|---|---|---|---|
| Provider wait | 4,786 | 6.8 h | 68% |
| Unattributed (QUIC) | 1,150 | 2.1 h | 21% |
| Probable tool activity | 196 | 48 min | 8% |
| Endpoint contention | 69 | 7.5 min | 1.3% |
| Upstream | 79 | 7.5 min | 1.2% |
| Network stall | 49 | 3.5 min | 0.6% |
| Local link | 2 | 3 s | under 0.1% |
| App busy | 1 | 1 s | under 0.1% |
The network-side causes add up to about 11 minutes, under 2% of the silent time. That’s one person on one Mac with a decent connection, so please don’t read it as a general result. Some caveats, too: the first-hop causes only arrived on October 10, old rows keep the rules they were written under, and the 21% unattributed could be hiding some network trouble.
The metrics I look at for a pause:
MAXGAP: the longest pause between arrivals, with tiny keep-alives excluded.SILENT: pauses over 1 s, counted by class.- Provider wait and network stall time, per interaction, in
timing. - Scope: whether other apps were affected at the same moment.
rCV, how even the delivery was. It describes how a server flushes, so it’s a shape and I don’t read it as a cause.
Summary
Silence on an encrypted stream can’t explain itself, so watson explains it from the evidence around it: retransmits and round trips, other connections from the same process, CPU, memory and heat. The rules run in a fixed order, with provider wait last and unattributed whenever QUIC hides the network.
On my machine, most of the waiting was the provider and very little of it was the network, so the SILENT column is worth reading before you touch anything.
The rule most likely to be wrong is the one that decides by elimination. A provider wait is whatever nothing else could explain, and a cause watson has no evidence for would land there too.