I don’t trust single-number scores much, and I built one anyway. People want a number they can glance at, and a table of TTFB, round trip, retransmits and stall time isn’t something you can read across twenty apps.
The hard part was keeping that number honest. A score of 100 from a stream where watson could see everything shouldn’t look the same as a 100 from a stream where it saw almost nothing.
The problem
There are a few ways a score like this goes wrong.
It can grade the wrong thing. If a provider thinks for 20 seconds and the score drops, you’ll go and blame your network for something it didn’t do.
It can compare the wrong things. A background config poll answers in a few hundred milliseconds, and a model call uploads a whole conversation and then waits for the model. Put them in one baseline and every real call looks several times too slow.
And it can pretend. QUIC hides retransmits and round trips. If you treat those missing parts as perfect, every HTTP/3 stream gets a beautiful score based on nothing.
How watson solves it
The Transport Score rates how well the network delivered one interaction, from 0 to 100, against what’s normal for that app. Good is 67 and up, OK is 34 to 66, and Poor is 33 and under.
TTFB, round trip and setup all use the same linear scale, where 1× baseline is 100, 2× is 50 and 3× or worse is 0:
score = 100 x (3 - value / baseline) / 2 clamped to 0..100
Retransmits score 100 at 0% and 0 at 2%, counted over at least 100 packets so that one retransmit in a ten-packet exchange doesn’t read as 10% loss. Stalls hit 0 when they take up 25% of the response.
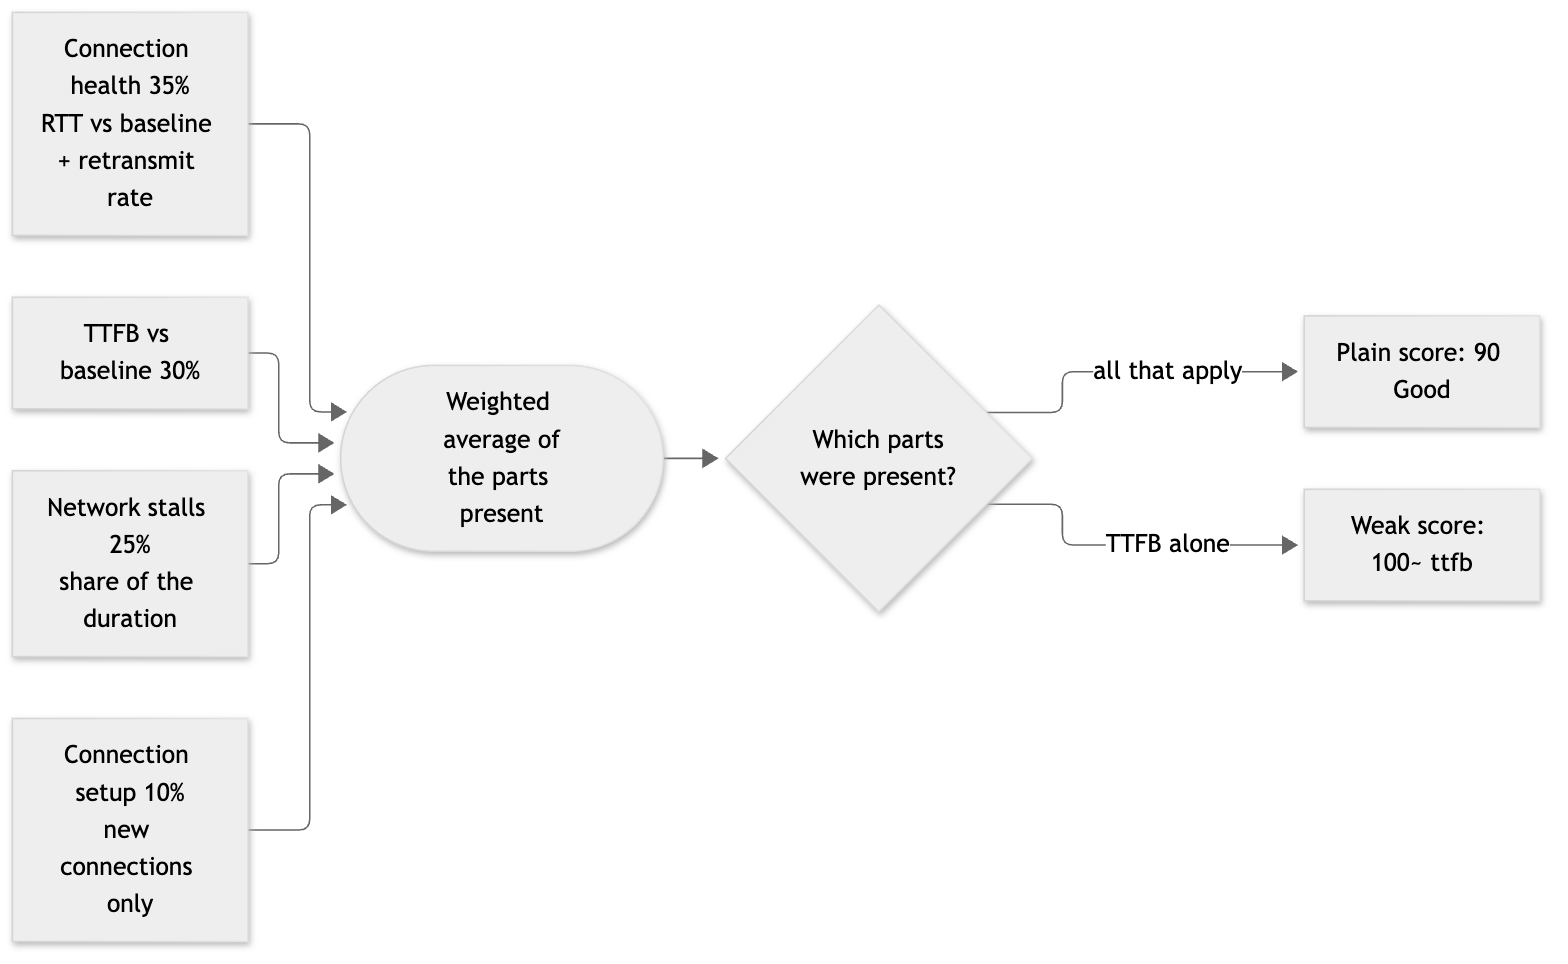
Missing parts are left out. They aren’t scored as zero or as perfect, and their weight is shared across the parts that remain:
score = sum(weight x component) / sum(weight of components present)
A healthy call on a reused connection works out like this. Baseline TTFB is 2000 ms and baseline RTT is 25 ms. The call has a TTFB of 2400 ms, an RTT of 30 ms, 2 retransmits in 400 packets and no stalls.
| Component | Input | Score |
|---|---|---|
| RTT | 1.2× | 90 |
| Retransmits | 0.5% | 75 |
| Health | mean of those | 82.5 |
| TTFB | 1.2× | 90 |
| Stalls | none | 100 |
(0.35 x 82.5 + 0.30 x 90 + 0.25 x 100) / 0.90 = 89.9 -> 90 Good
The weights add up to 0.90 because a reused connection has no setup to measure. These worked examples are checked by a test in the repo, so the numbers in the docs can’t drift away from the code.
Baselines are per provider, app and upload size. Each one is a rolling median of the last 500 interactions. Under 4 KB uploaded is small, and anything else is large. Each interaction is scored against the baseline before it’s added, and a baseline needs 5 samples before it’s used. Multiplexed interactions and idle heartbeat streams never feed one, because they’d distort what normal looks like.
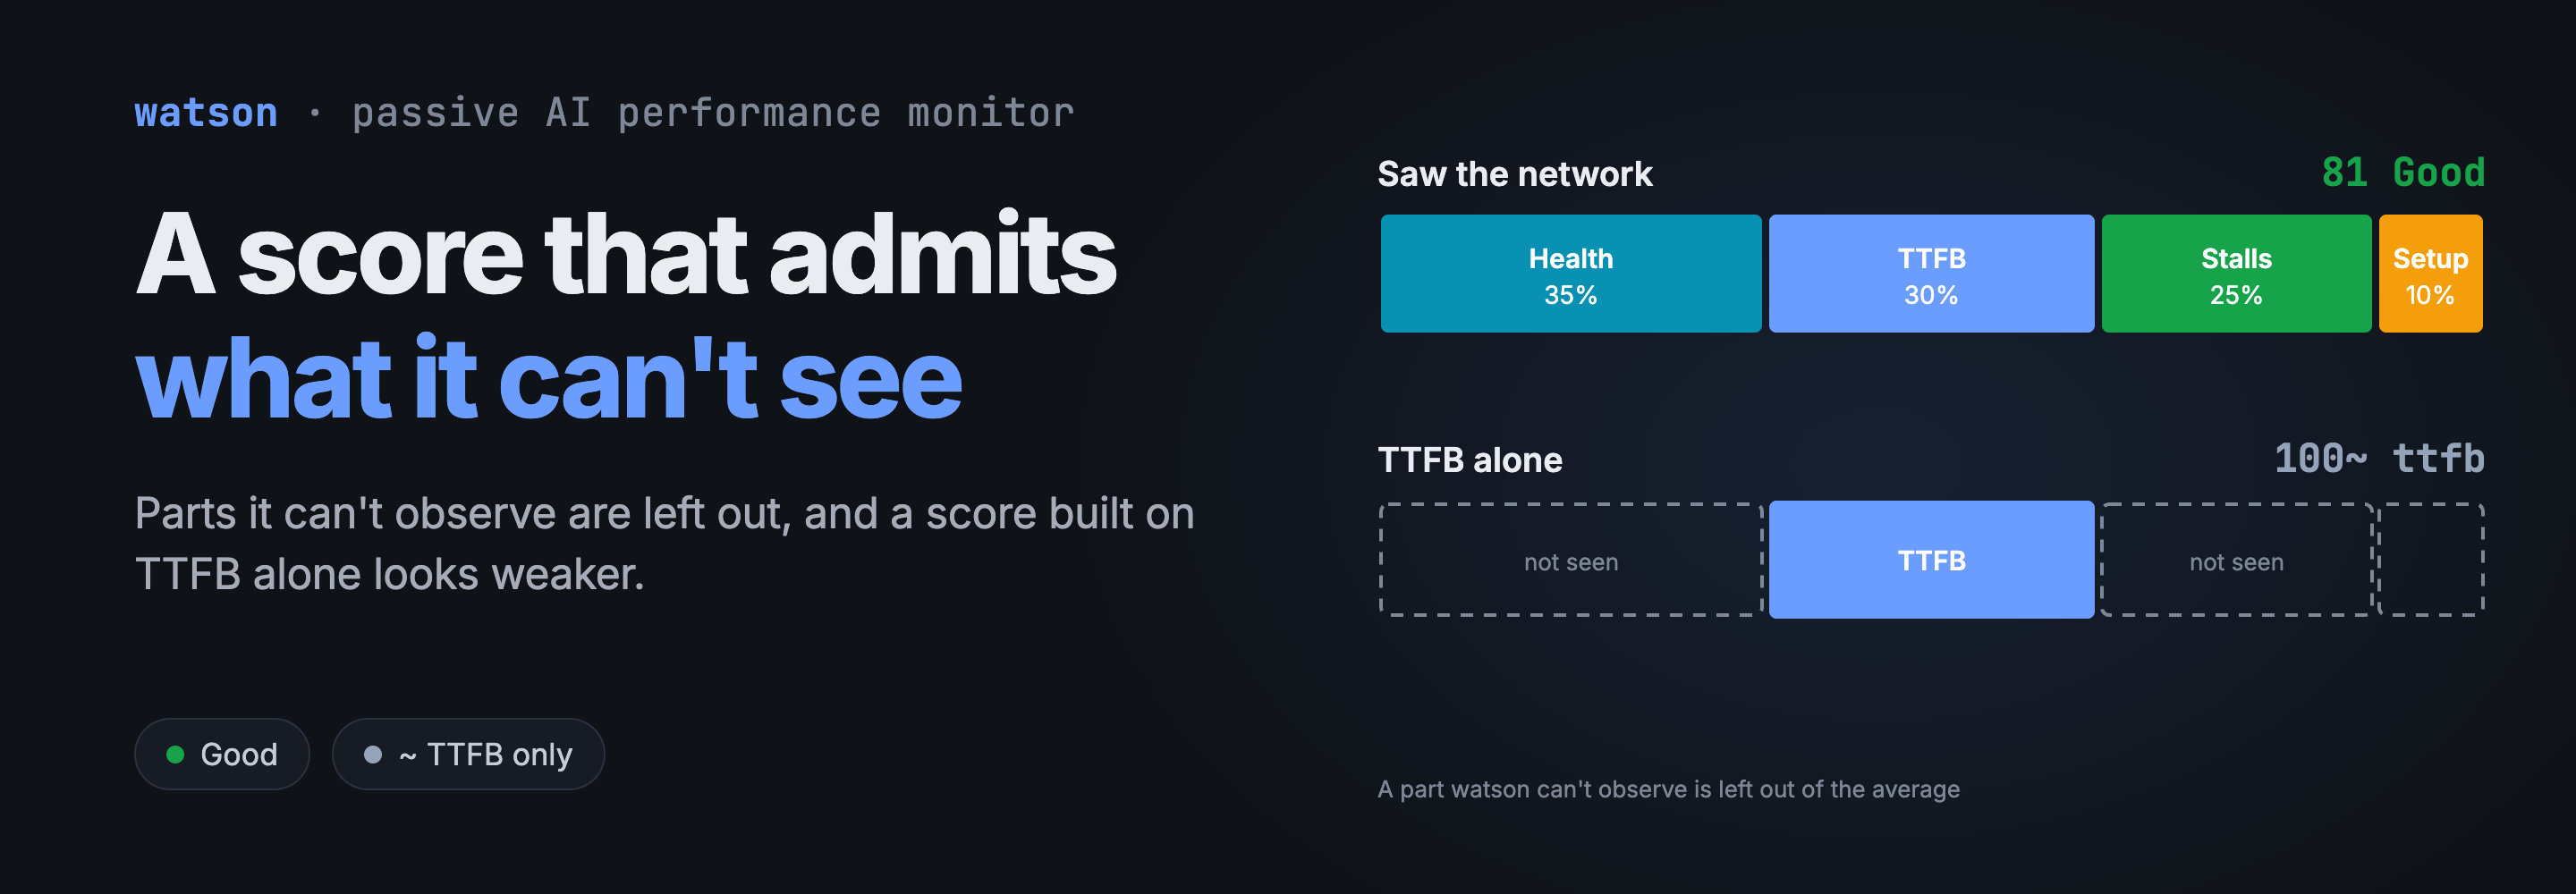
A weaker score looks weaker. When TTFB is the only part present, the terminal shows 100~ and the band reads ttfb instead of Good. On the page it’s a dashed, hollow pill, in a turn’s table and on the turn itself. The value doesn’t change, only how it’s presented.
Confidence is separate from the band. A Good score can be Low confidence. Medium means a browser stream with exact timing from the page and no network evidence. Low means QUIC, multiplexed traffic, or a part without its baseline. All of these come with a reason, such as no baseline for Anthropic/Claude web (small uploads): round-trip 1 of 5 samples.
This is a real turn from Claude Desktop over QUIC. Only one of its five interactions got a score, and it’s the dashed 95~.

Troubleshooting steps
When a score looks wrong, I go through this.
- Check for a
~. If it’s there, the score only says the first byte was on time, or wasn’t. It says nothing about the network. - Check the confidence and its reason. Low plus a good score usually means the baseline is still filling up.
-
Look at the components in the log. One zero explains most low scores:
jq -c 'select(.app == "Claude Code" and .transport_score.band == "Poor") | {time, ttfb: .timing.ttfb_ms, score: .transport_score}' ~/.watson/records.jsonl - If
network_stallsandconnection_healthare fine andttfbis 0, the network probably isn’t your problem. Compare the round trip with its baseline. - If
connection_healthis low, separate its two parts. Retransmits point at loss and a high RTT points at the path. - Compare an app only against its own history. A browser’s TTFB runs from the page’s request to the response headers, which is a different measurement from native TTFB, so a browser score is only judged against the browser app’s own baseline.
- On the page, keep colour and band apart. Colours are green from 80, amber from 60 and red under 60, while the Poor count still uses the 0 to 33 band. A red score can sit beside a Poor count of 0, and that’s deliberate.
Metrics in focus
The last Poor row Claude Code has in my log is a good one to read:
{"ttfb": 12223.35, "score": {"value": 28, "band": "Poor",
 "connection_health": 0, "ttfb": 0, "network_stalls": 100}}
A first byte at 12 s scores 0, and health is also 0. Stalls are at 100, so the arithmetic is (0.25 × 100) / 0.90 = 27.8, which rounds to 28.
Across my log, October 2 to November 7:
| App | Good | OK | Poor | Mostly |
|---|---|---|---|---|
| Claude Code | 11,684 | 959 | 15 | High confidence, full score |
| Gemini web | 313 | 49 | 56 | Medium confidence, TTFB alone |
| ChatGPT web | 223 | 7 | 4 | Medium confidence, TTFB alone |
| Codex | 209 | 22 | 0 | About half Low confidence |
Don’t compare those rows with each other, because scores aren’t comparable between apps. What’s interesting is what they show about a single row’s strength. All 56 of Gemini’s Poor rows are TTFB-only and Medium confidence, with a median first byte of 591 ms. An app with a fast normal hits 3× baseline quickly. Those rows say the first byte was late compared with normal, which is a much smaller claim than the word Poor suggests, and it’s why the terminal prints ttfb as the band.
There are two limits I keep running into, and I haven’t solved either.
The TTFB component mixes network and provider. Provider waits inside a stream never lower the score, but TTFB includes the server’s time to respond, so a slow model start can cost around 30 points. The score doesn’t mean “the network alone”, and I’ve stopped describing it that way.
It also saturates. TTFB is 0 at 3× baseline, and 100× baseline is still 0. I have a Claude Code row with a 29 second first byte against a normal of about 620 ms, and its score is 41, which is OK. In the same 48 hours Claude Code had 788 scored interactions, a median of 96 and no Poor rows, while watson’s slow rule (a first byte or token at 5× baseline and 1 s above it) flagged 28 of its 92 turns. These two views disagree, and I think the disagreement is correct: the score is about how the network delivered, and the slow rule is about how it felt. It does mean you shouldn’t use the score alone to decide whether someone had a bad time.
Things I left out of the score on purpose: rCV, because it mostly reflects how a server flushes. Duration and KB/s, because a long answer isn’t a slow one. Provider waits, for the reason I gave above.
Summary
The score is a weighted average of whatever watson could actually observe, compared with that app’s own history. Parts it can’t see are left out, and a score resting on TTFB alone is drawn differently so it can’t pass for one that saw the network.
A 100 means “as good as normal” and nothing more, and a slow provider that’s always slow scores well against itself. The number is a place to start reading. The components and the reasons behind it are what you act on.