“Is it my Wi-Fi?” is the question I ask most often, usually right before I do something pointless like toggling it off and on. Until October, watson could say a network stall happened but couldn’t say where. A stall in my living room and a stall three networks away looked the same.
Then there’s the rest of the laptop. A machine that’s swapping or being thermally throttled makes an AI app feel slow too, and from the network’s side it looks like the data just stopped coming.
The problem
Retransmits and round-trip spikes tell you the path had a problem. They don’t tell you which part of it, and that’s the only thing you can act on. Your router is yours to fix and the rest of the path isn’t.
The machine has the same issue. “CPU was high” is true for a lot of the day and explains very little by itself. Low-power mode can stay on from morning to night, and if every pause during it counts as throttling, every provider wait gets blamed on your battery.
How watson solves it
While watch runs on macOS, it samples the device as well as capturing packets.
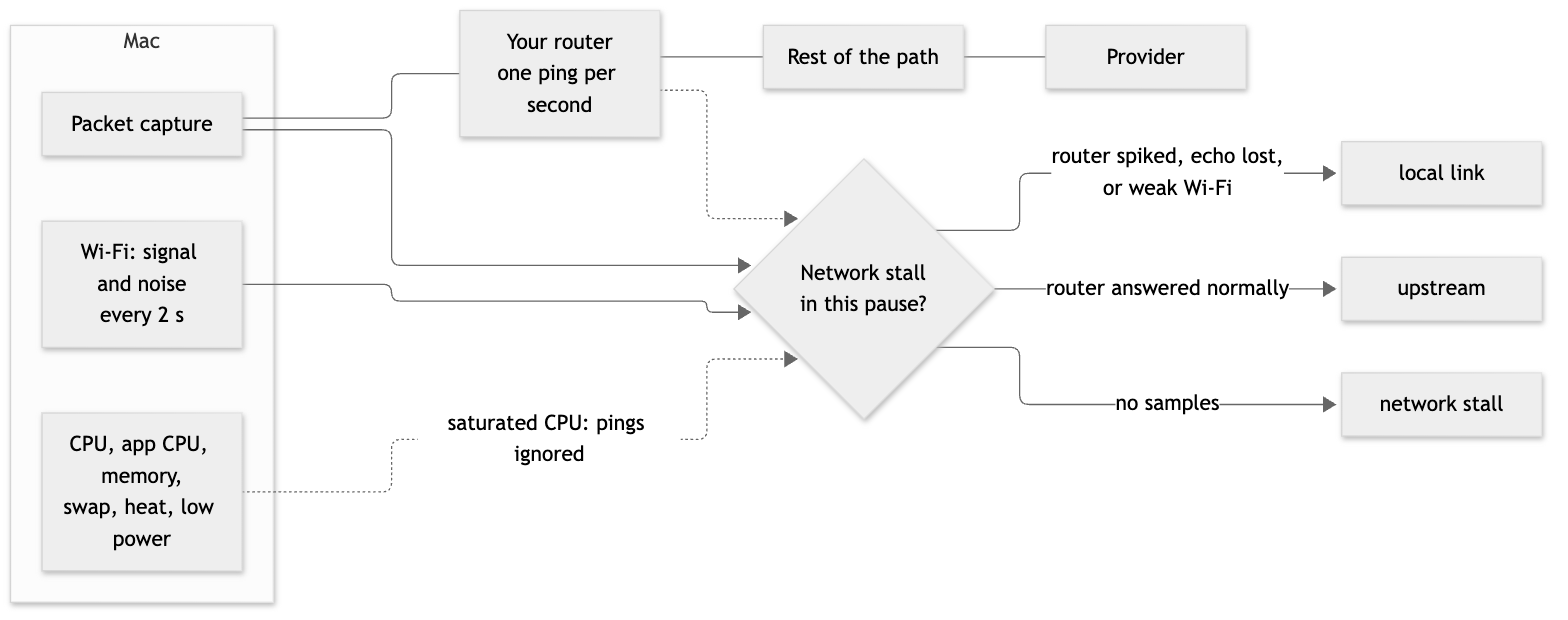
The router ping is the one exception to watson only observing: one ICMP echo per second to your default gateway. It carries the fixed text watson, stops at the router and tells you nothing about your traffic.
A stall gets named local-link if the router’s round trip spiked, or an echo was lost during the pause and the router has answered in the last 10 minutes, or if Wi-Fi was weak: -75 dBm or worse, or under 20 dB above the noise. It’s upstream if the router answered normally. With no samples it stays a plain network stall.
The most useful rule came from being wrong. A busy machine delays its own pings. So an echo sent while this machine’s CPU was saturated is ignored, and if that was the only spike, the pause stays a plain network stall. Before that rule, a CPU spike could make a healthy router look broken.
QUIC gets some help from this too. It hides retransmits and round trips, but the first hop is still visible, so a router spike during a pause can be named local-link even on a stream watson otherwise can’t see into.
On the device side, each cause needs a second condition:
throttledneeds thermal pressure or low-power mode and the app at its CPU ceiling, or the whole system saturated, during the pause.app-busyneeds the app’s own process above 90% of one core for at least half the pause, or memory pressure, or swapping above 1 MB/s. All of these can happen while the machine as a whole looks idle.endpoint-contentionneeds system CPU above 90% with the app itself not at its ceiling.
Local-link, upstream and throttled pauses lower the score. I went back and forth on this, since the score is meant to rate the network. A response that was slow because of your Wi-Fi was still a slow response, though, and a score that said Good while the Wi-Fi was failing wouldn’t match what you felt. app-busy and endpoint-contention don’t count, which is a call I could still change.
One more thing lives here, the cross-app scope. It compares a pause with what other apps were doing: “several apps” means an app on a different provider had trouble too, “same provider” is ambiguous, and “this app only” means other apps were active and fine. You can’t get that from a tool that only watches one app.
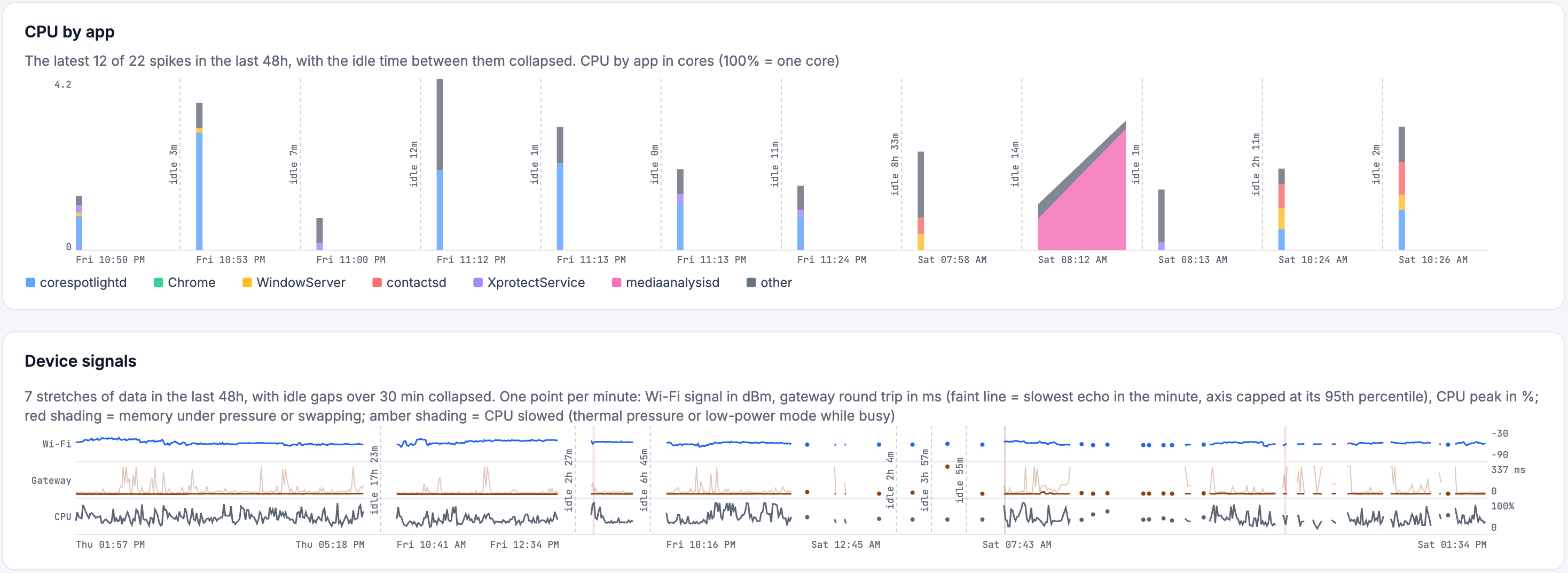
The Device page shows what used the CPU during each spike, with Wi-Fi, the router and CPU underneath.
A real example
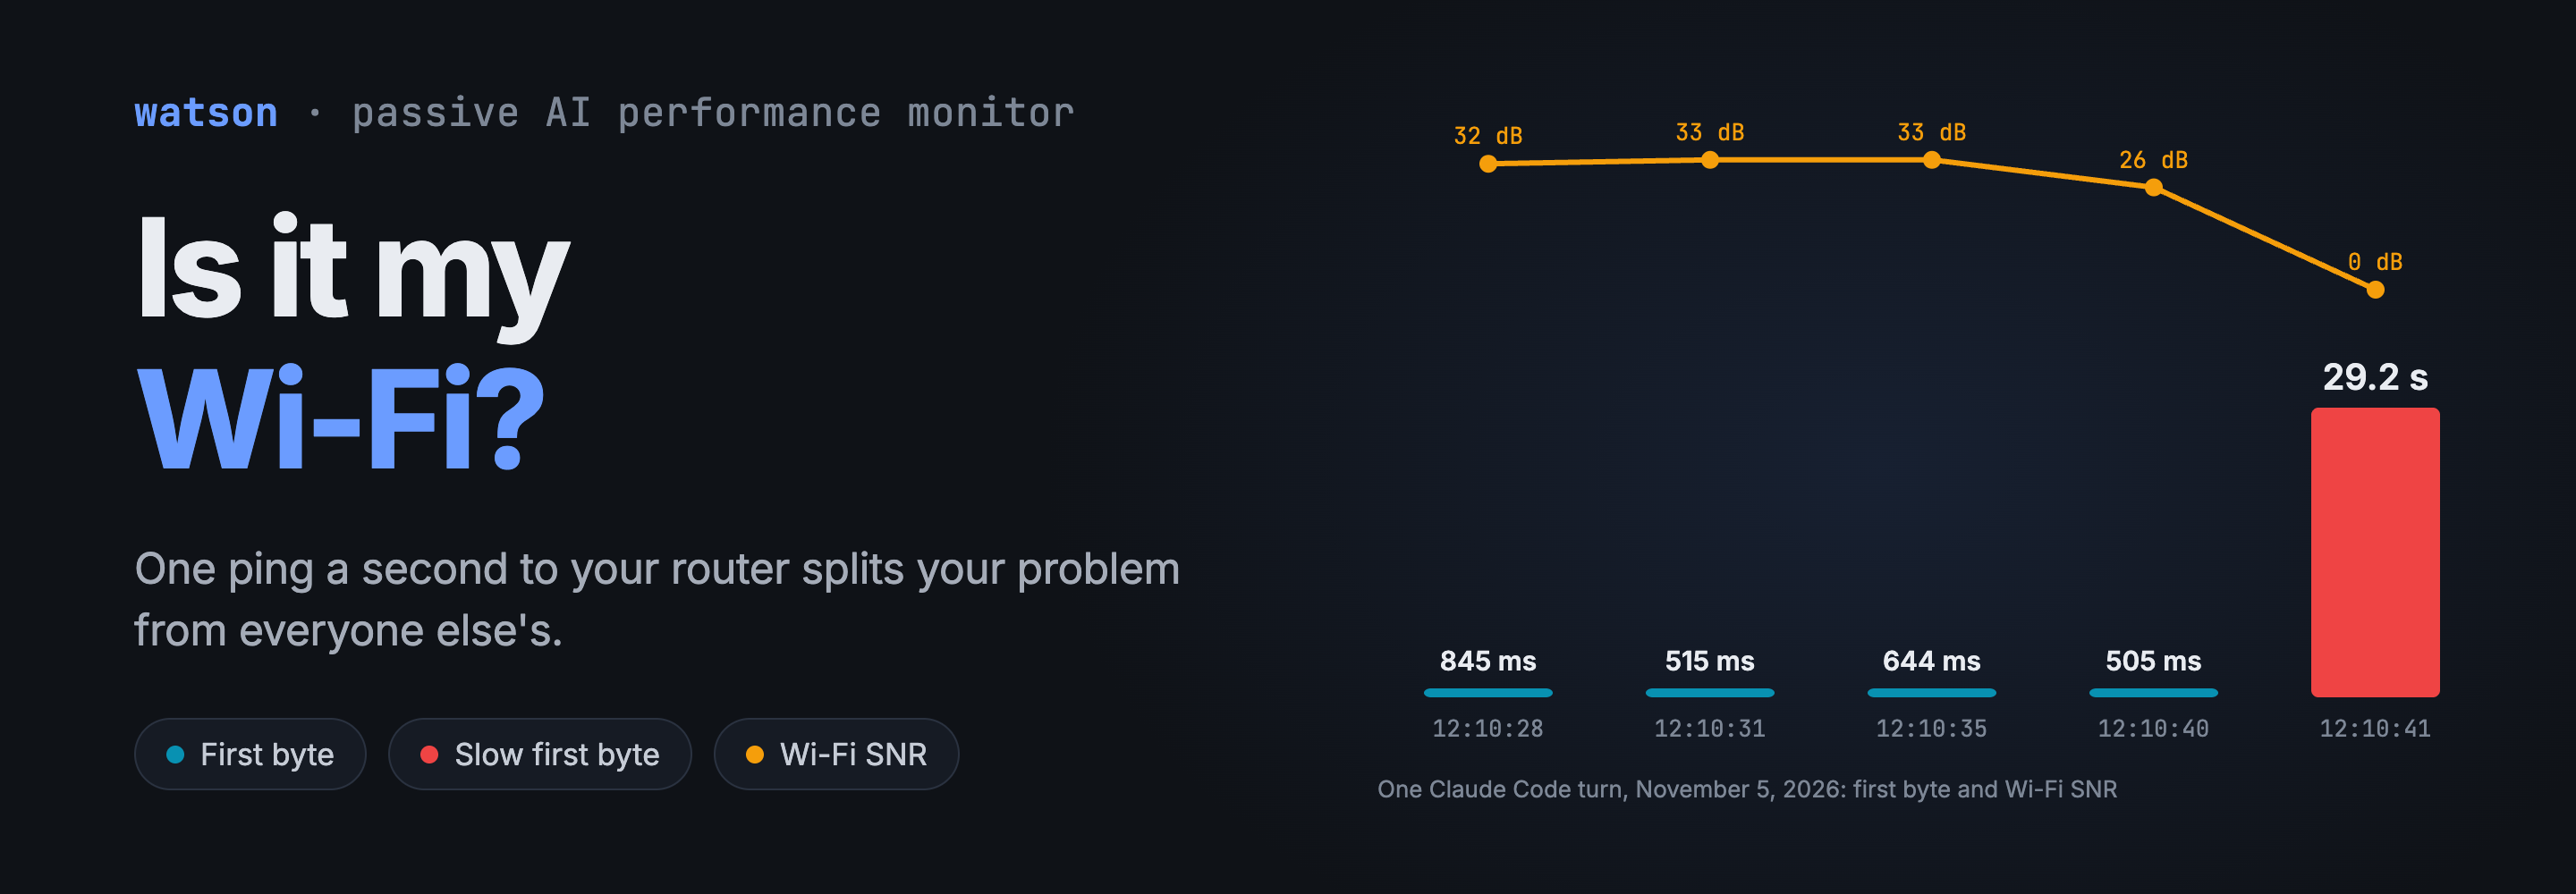
This is from my machine on November 5, a five-interaction Claude Code turn, around 12:10.
| Time | First byte | Score | Wi-Fi SNR |
|---|---|---|---|
| 12:10:28 | 845 ms | 81 | 32 dB |
| 12:10:31 | 515 ms | 90 | 33 dB |
| 12:10:35 | 644 ms | 99 | 33 dB |
| 12:10:40 | 505 ms | 88 | 26 dB |
| 12:10:41 | 29.2 s | 41 | 0 dB |
The last request reused the connection, and its first byte took 29.2 s against a normal of about 620 ms. Round trip was 33 ms against a normal of 20, with 2 retransmits. The minute’s device summary shows 15 lost echoes, the only minute that day with 5 or more. At 12:10:47, Claude Code failed to connect to the same service on both its IPv4 and IPv6 addresses. By 12:11 the SNR was back to 30 dB.
So that looks like a brief Wi-Fi drop. I can’t say why it happened. There’s nothing in the log about a roam or an access point change, and I read the 0 dB as the radio being mid-drop more than as a true measurement. watson doesn’t confirm that.
The row also showed a gap in watson. The 29 seconds came before the first byte, and only pauses inside a response were silent periods. So it had no local-link cause, and its stalls component read a perfect 100. The device labels did catch it, “weak Wi-Fi” and “slow router”, and the TTFB component scored 0, so you could still find the explanation.
My first idea was to run these waits through the same rules as any other pause. The log talked me out of it. Of the TCP rows with a first byte over 1 s, 40.3% have a retransmit, and across all TCP rows it’s 39.9%. Retransmits are routine on my link and have nothing to do with slow first bytes, and most of these waits are the model starting. Using them could have blamed the network for up to 40% of ordinary waits.
So the rule is narrow. A wait of over a second becomes local-link only if at least 2 router pings were lost during it, the CPU wasn’t saturated, and the router has answered in the last 10 minutes. That last part is there because some routers block pings, and then every ping looks lost. At most 2 of 4,447 slow first bytes in my log qualify, and that row looks like one of them, though records don’t keep ping times, so I can’t replay it to be sure. The score doesn’t change, because TTFB already counts the wait. A problem past the router during the wait still gets no cause.
Troubleshooting steps
- Find the turn and read its Note column on the page. The first label is the cause of the longest non-provider pause, and the rest describe the device during the response: weak Wi-Fi, slow router, unstable router, app at ceiling, CPU busy, memory, swapping, hot, low power, slow DNS, VPN.
- Check the scope. If other apps on other providers suffered at the same moment, it’s your machine or your link.
- If it’s
local-link, look at Wi-Fi first. Low SNR with a normal router round trip points at the radio. A slow router with a good signal points at the router or what’s behind it. - If it’s
upstream, your first hop was fine, and restarting your Wi-Fi won’t help. - If it says “machine busy” on the turn, whole-machine CPU hit 70% or more while nothing was on the wire. The Device page lists what was using it. It’s a hint, because any app can make a machine busy.
- A slow first byte with no cause means no router pings were lost during the wait. Check the conditions on the row, and compare the round trip with its normal.
To see the bad minutes in your device log:
jq -c 'select(.snr < 20 or .lost > 0) | {t, rssi, snr, gw_med, gw_max, lost}' ~/.watson/device.jsonl
Metrics in focus
On my machine, across 11,086 interactions with device data, the median router round trip was 5.6 ms and the median SNR was 35 dB. About 1% of them (110) touched weak Wi-Fi. Thermal pressure touched none of them, swapping over 1 MB/s touched one, and 352 had the machine at 70% CPU or more in the quiet stretch before them. It’s a good connection on a capable laptop, so I’m mostly testing the healthy path, and the rare causes have seen very little real traffic. local-link has fired on 2 pauses in my log.
The metrics, all numbers with no network names or addresses:
rssiandsnr: Wi-Fi signal and signal over noise. Weak is -75 dBm or worse, or under 20 dB.gw_med,gw_p90,gw_max,gw_jit,lost: router round trip, jitter (the mean change between echoes) and lost echoes.cpuandapp_cpu: whole-machine and the app’s own.mem,swap,therm, low power: memory pressure, swap rate, thermal level.quiet_cpu: peak CPU in the quiet stretch since the app’s previous interaction.
The Wi-Fi and router sampling is macOS only for now. On other systems a stall stays a plain stall.
Summary
watson splits a network stall at the router, with one ping a second and a Wi-Fi reading every 2 seconds. It adds CPU, memory and heat, and it requires a second condition before blaming any of them, because each one is true too often to mean much alone.
It still can’t tell you why your Wi-Fi dropped. It can tell you it dropped during the request that took 29 seconds, which on a good day saves me from restarting the wrong thing.