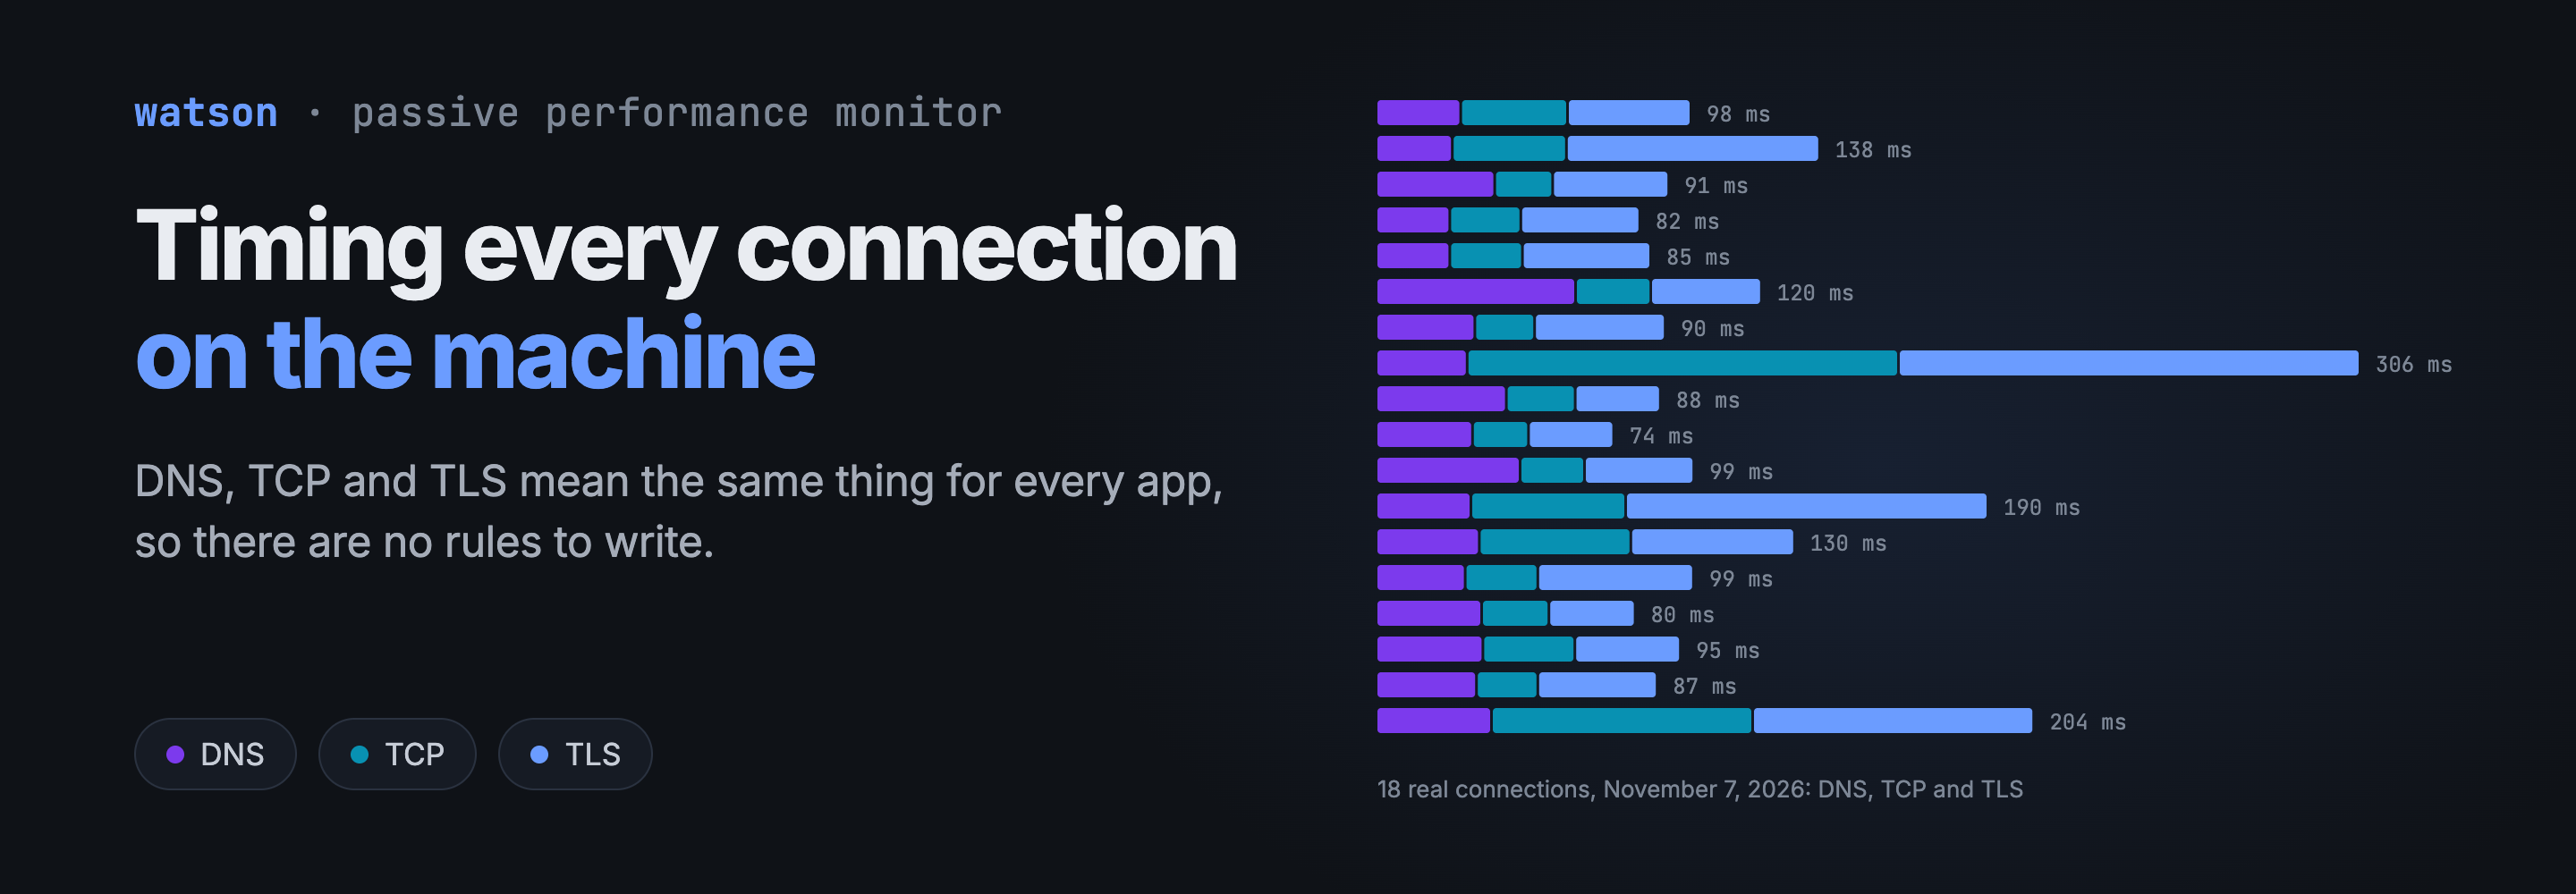
For its first few weeks, watson ignored almost everything on the machine. A connection to a host outside its registry was dropped after the ClientHello, so a sync client that was failing or a chat app that took two seconds to connect simply didn’t exist.
Extending that to every app looked like a lot of work: a rule per app and a definition of a good response for each one. Then I noticed that one part of a connection means the same thing everywhere.
The problem
DNS, the TCP handshake and the TLS handshake happen before any application data moves. They look the same for a mail client and an AI app, and you don’t need to know anything about the app to say whether its handshake was slow.
Without that view, an awkward kind of problem is invisible. A person says Slack feels slow to open. The app works fine once it’s connected, and your AI scores look perfect. Meanwhile the setup might be taking a couple of seconds every time.
Three things stood in the way:
- Writing a registry rule for every app first isn’t realistic, and it keeps every unregistered app invisible until someone gets to it.
- Rows need to name real apps. “Unknown process” and
com.apple.somethingaren’t what people associate with their work. - Logging every host a browser connects to would be a browsing history on disk, and I didn’t want to create that.
How watson solves it
watson now times the setup of every TCP/443 connection and counts every QUIC/443 flow, whatever its destination or process. The registry still decides which connections get interactions and scores. For everything else, it only names the owner.
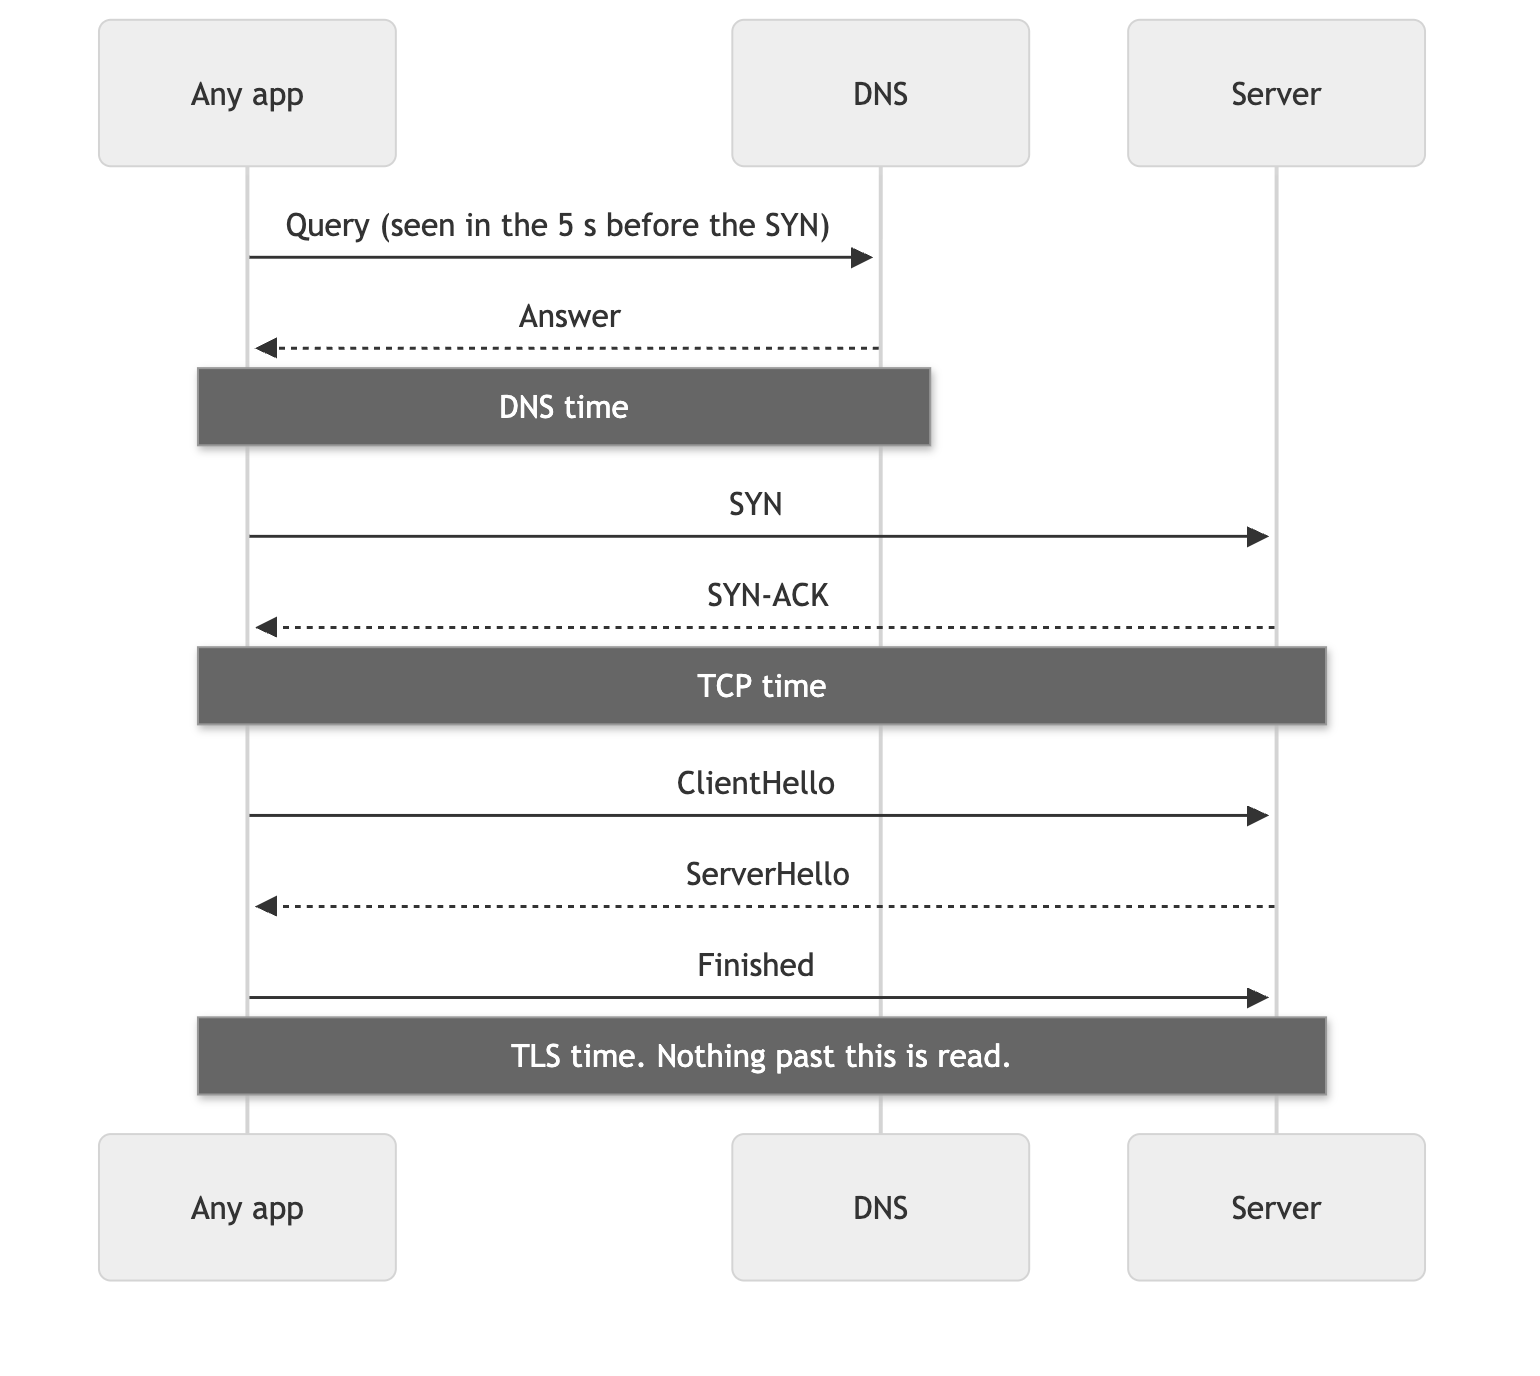
Each connection gets one line in connections.jsonl, written when it closes. It holds the owner, process, host, DNS, TCP and TLS times, TLS version, whether the session resumed, bytes, lifetime and any failure. A part watson didn’t see is left out and never written as 0. A QUIC flow has no TCP handshake and its TLS is encrypted, so it gets bytes and lifetime only.
Naming was the part that took the most real-world fixing. On macOS, lsof doesn’t see the connections Network.framework makes in user space for Safari, Mail and system services, so most connections were “Unknown process”. watson reads nettop now, with lsof as a fallback. A helper process is counted as the app macOS holds responsible for it, so Claude Helper is Claude and Safari’s WebKit networking service is Safari. A program you run from a terminal keeps its own row and also counts on the terminal’s row, listed as gh api.github.com.
Browsers are handled differently. A browser connection is stored without its host or address. So is a connection with no known process, since it could be a browser’s. The timings are still kept, so a browser gets one row for all its sites, and the file isn’t a browsing history. If you want per-site figures, watch --browser-sites saves the registrable domain (slack.com, never app.slack.com). It’s off by default, and it says so when it starts.
Setup timing alone couldn’t answer whether anyone cared, since a slow background daemon matters much less than a slow app you’re typing in. So on macOS, watch also samples the frontmost app every 5 seconds and how long ago the last input was. That’s the Active column. It keeps app names only, with no window titles, URLs or documents, and it never sees the keys.
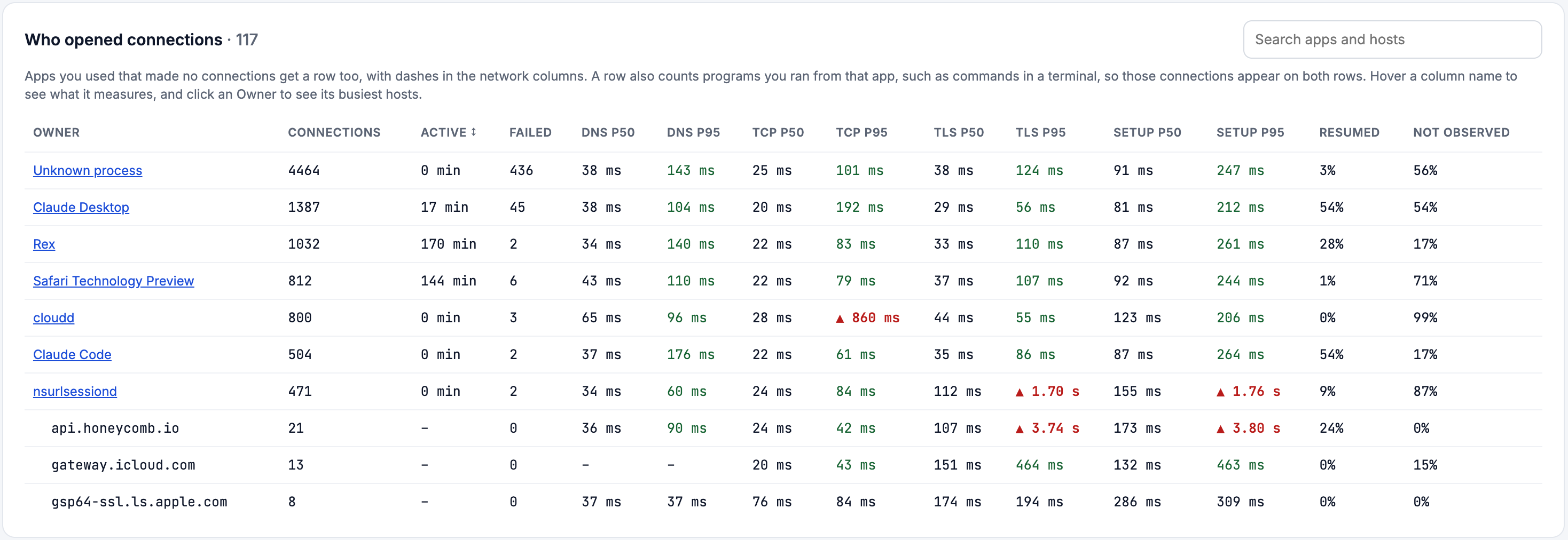
Here’s the top of that table from my machine, with nsurlsessiond, the macOS background downloader, opened to its hosts. I’ve left out the ones that only have an IP address. The red ▲ on api.honeycomb.io is a TLS p95 of 3.74 s against a p50 of 107 ms.
Troubleshooting steps
When an app is slow to connect or fails:
- Open the Connections tab and search for the app. Only look at the percentiles once it has a fair number of timed connections. The page gives no colour under 10.
- Check Failed first. A connection failed if it got no SYN-ACK in 75 s, or a reset before TLS completed.
- Compare p50 with p95. A red ▲ means p95 is at least 5× p50 and at least 200 ms above it, so it’s a tail problem and most connections are fine.
- Find which part is slow.
- High DNS: look at your resolver. A dash means the lookup wasn’t seen, because the address was cached or the lookup was encrypted.
- High TCP: that’s the round trip to that server, plus any loss on the handshake.
- High TLS with normal TCP: the server, or something on the path that takes part in the handshake, is taking its time. Check the Resumed share too, since a full handshake costs more than a resumed one.
- Click the row and look at its 10 busiest hosts. One bad host is a very different problem from all of them being slow.
- Check Active. If nobody was in that app, it might not be worth your afternoon.
- Read “Not observed” before trusting a percentile. A high share means QUIC or connections that were already open, and those have no timing.
From the log:
jq -r 'select(.failure) | [.owner, .failure] | @tsv' ~/.watson/connections.jsonl \
  | sort | uniq -c | sort -nr
Metrics in focus
From the last 48 hours on my machine (November 5 to 7):
| Connections | 12,093, from 117 owners |
| QUIC (no setup timing) | 6,086, about 50% |
| Failed | 468: 448 at connect, 20 at TLS |
| Part | p50 | p95 |
|---|---|---|
| DNS | 36 ms | 141 ms |
| TCP | 23 ms | 108 ms |
| TLS | 38 ms | 165 ms |
| Setup | 95 ms | 314 ms |
Half of the connections can’t be timed at all. The “Not observed” column is there for this, because a p95 built on half the traffic should say so.
These are the owners with the longest tails, with at least 10 timed connections:
| Owner | Connections | Setup p50 | Setup p95 | p95 / p50 |
|---|---|---|---|---|
| nsurlsessiond | 448 | 155 ms | 1,764 ms | 11.4× |
| netbiosd | 67 | 95 ms | 942 ms | 9.9× |
| AddressBookSourceSync | 126 | 119 ms | 809 ms | 6.8× |
| Copilot | 91 | 137 ms | 895 ms | 6.5× |
| Claude Code | 467 | 91 ms | 279 ms | 3.1× |
Most of the top of that list is background work, and I wouldn’t lose sleep over it. That’s the reason for the Active column. It’s a good example of what the tab is for, though: none of those apps needed a rule, and I’d never have looked at any of them otherwise.
The number I’m least happy with: 4,096 of those 12,093 connections, a third, belong to “Unknown process”, and that row holds 367 of the 468 failures. Most of them (3,819) lived under 2 seconds, which fits the known limit. watson polls the process table once a second, so a connection shorter than that can finish before it’s seen. It says Unknown when it doesn’t know, and I prefer that to a guess, but a third is a lot. It also means I can’t tell you what most of the failures were.
The red ▲ rule itself isn’t calibrated, either. I picked the 5× and 200 ms from one 48-hour look at my own data. It’s a reading aid and I wouldn’t defend the thresholds.
Summary
Setup is the one measurement that means the same thing for every app, so watson now takes it for every HTTPS connection, with no rules to write. The registry still decides what gets a score, and browsers keep their hosts off disk unless you opt in.
The tab has a real blind spot: half the traffic is QUIC, a third has no process name, and a long-lived connection only appears once it closes. It still shows every app on the machine with no setup, which the AI views never could.